
Data Visualization
Featured Topics
Lead story
Other featured articles
-
The Price of Insulin, Explained
This animation explains research by Schaeffer Center experts that offers one of the most comprehensive looks at the insulin distribution chain and shows which players are profiting, and by how much, from selling insulin.
Posted in -
Untangling the Price of Insulin
Despite its discovery nearly 100 years ago, insulin’s list price has been going up, not down. Schaeffer Center researchers analyzes the flow of money across all distribution system participants—manufacturers, wholesalers, pharmacies, pharmacy benefit managers (PBMs), and health plans.
Posted in -
County-Level COVID-19 Vaccination Coverage, By Social Vulnerability and Vaccine Hesitancy
In the charts below, we explore the impact of social vulnerability and vaccine hesitancy using data made available by the Centers for Disease Control and Prevention (CDC) and the Department of Health and Human Services. Last updated: June 5, 2022 We define hesitancy as the percentage of residents who said that they would “probably not” […]
Posted in -
Fewer Pharmacies In Black And Hispanic/Latino Neighborhoods Compared With White Or Diverse Neighborhoods, 2007–15
A new study in Health Affairs finds one-third of neighborhoods in the largest US cities are pharmacy deserts with most located in Black and Latino neighborhoods.
Posted in
All Data Visualizations
-

How Would Sharing Rebates at the Point-Of-Sale Affect Beneficiary Cost-Sharing in Medicare Part D?
If cost-sharing were based on net price it would provide meaningful financial relief to many Part D beneficiaries.
Categorized in -

National Trends in Mental Health-Related Emergency Department Visits by Children and Adults, 2009–2015
Utilization of emergency department services for mental health-related visits can be challenging for hospitals to manage. This study showed mental health-related visits grew by 56 percent for pediatric patients and by almost 41 percent for adults.
-
Hospital System Participation and Hospital Spending
Most hospital systems span across markets and states with higher system participation were more likely to have below median per capita hospital spending.
Categorized in -
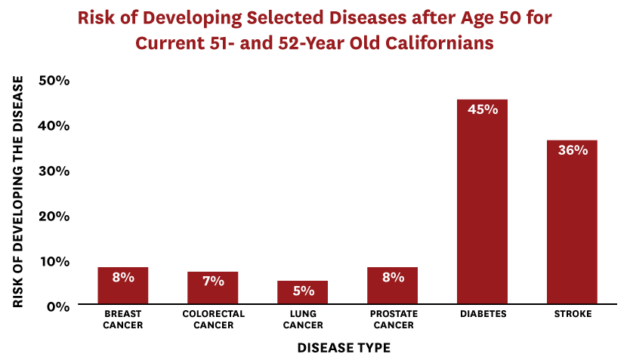
Future Health Dividends for California: Valuing Medical Innovations
Reducing the incidence of four common cancers (breast, colon, lung, and prostate cancer), diabetes and stroke by 50 percent would generate nearly $900 billion in social value for California between 2018 and 2040. Just a 10 percent decline generates $175 billion over the same period.
Categorized in -
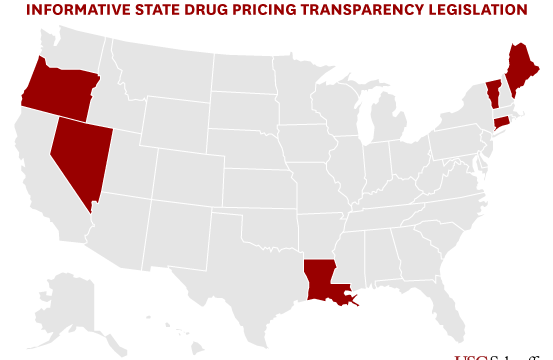
Data Visualization: State Drug Transparency Laws
States are increasingly enacting price transparency laws designed to provide regulators or the public with more information about how entities in the drug distribution system set prices. The data visualization summarizes the 35 drug pricing transparency bills enacted in states between 2015 and 2018.
Categorized in -

Geographic Variation in the Delivery of High-Value Inpatient Care
Hospitals in Miami produced 13 percent fewer high-quality hospital stays than the U.S. average, while hospitals in Everett, Washington, a city 25 miles north of Seattle, perform over 20 percent better than average on value.
Categorized in