Developed over 100 years ago, insulin is a life-saving medication for patients with type 1 and type 2 diabetes. Since its discovery, many varieties of insulin have become available, allowing individuals with diabetes to live long, high-quality lives.
Today, almost 11% of the U.S. population has diabetes and 1.5 million Americans are diagnosed every year; one in three adults has prediabetes. Approximately 9.3 million Americans take insulin to manage their condition. As the population needing insulin has increased, so too have list prices of insulin products, causing many patients to face large out-of-pocket costs.
While there has been increased national attention on the costs of insulin and several studies have shown a widening gap between the “sticker” or list price of insulin and what manufacturers ultimately receive, trade secrets and protections have prevented researchers and other outsiders from thoroughly understanding where the money spent on insulin goes across payers the distribution system.
We combined data from many sources, including reports from state governments that recently passed drug pricing transparency initiatives, to gain greater insight into the economics of the insulin drug distribution system. The results of this study were published in JAMA Health Forum.
Key Takeaways
- Although policymakers and media have increased their focus on insulin affordability, lack of transparency in the insulin distribution system has obfuscated the role each intermediary plays in determining insulin costs.
- Published in JAMA Health Forum, our paper evaluates the flow of money between manufacturers, wholesalers, pharmacy benefit managers, pharmacies and health plans.
- Between 2014 and 2018, the share of net expenditures going to manufacturers has decreased, while the share going to middlemen has increased.
- As a result, the cost to the healthcare system has remained relatively flat. Although manufacturers are taking less, patients have not benefited from these savings.
Following the Money
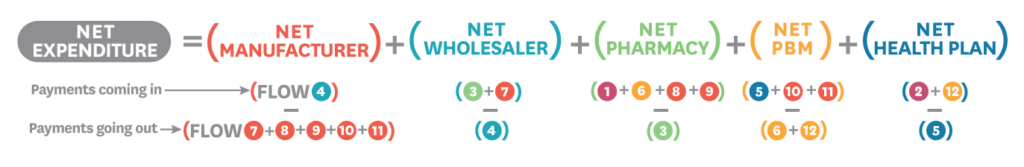
There are six major players in the distribution of insulin: manufacturers, wholesalers, pharmacies, pharmacy benefit managers (PBMs), health plans and patients. The diagram below illustrates the ways in which money flows between these entities.
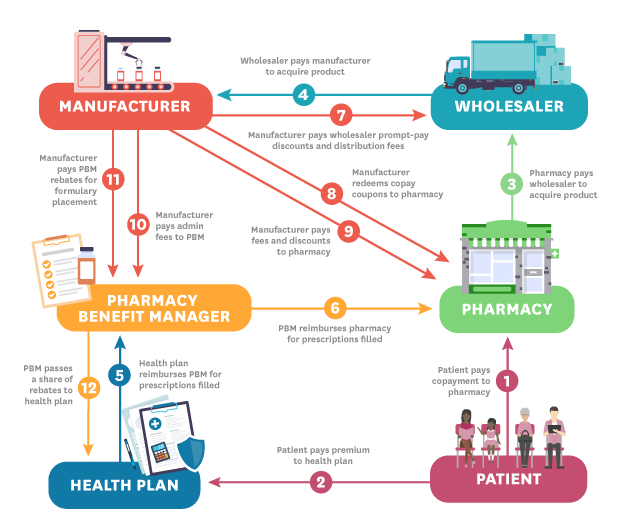
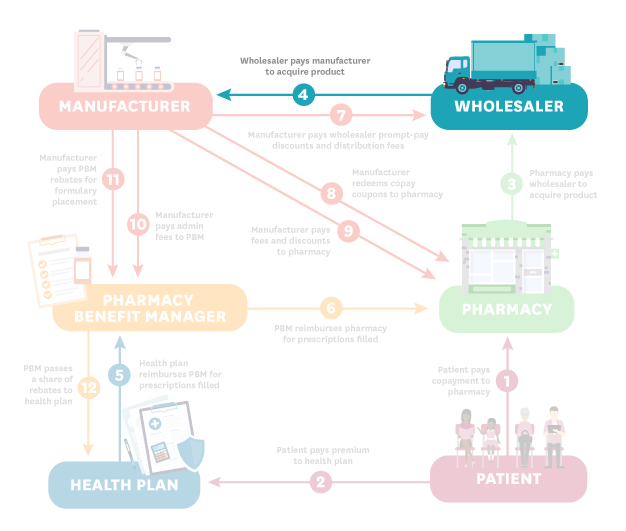
Each step is described below:
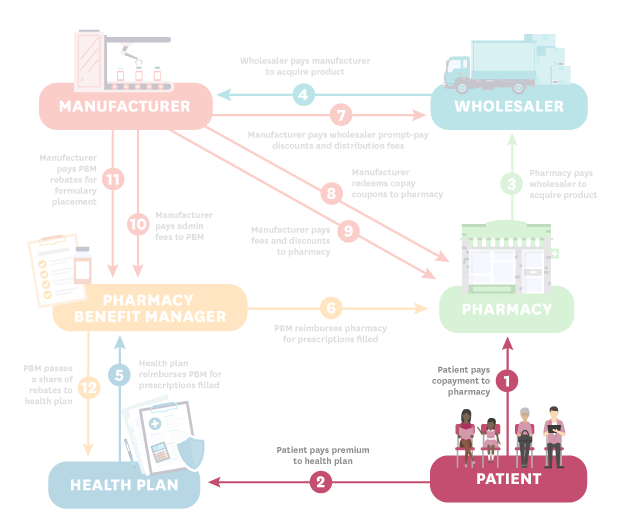
- Patient (Steps 1 and 2): The process starts when the patient pays their copayment to the pharmacy. In this hypothetical, the patient is insured so they also pay a premium to the health plan.
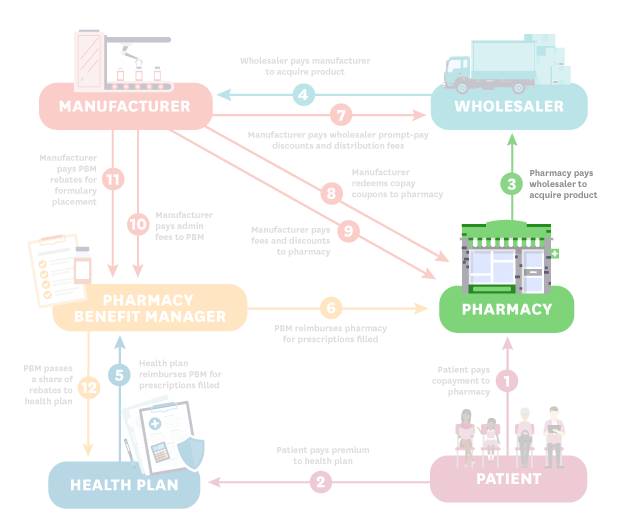
- Pharmacy (Step 3): The pharmacy pays the wholesaler to acquire the product.
- Wholesaler (Step 4): The wholesaler pays the manufacturer to acquire the product.
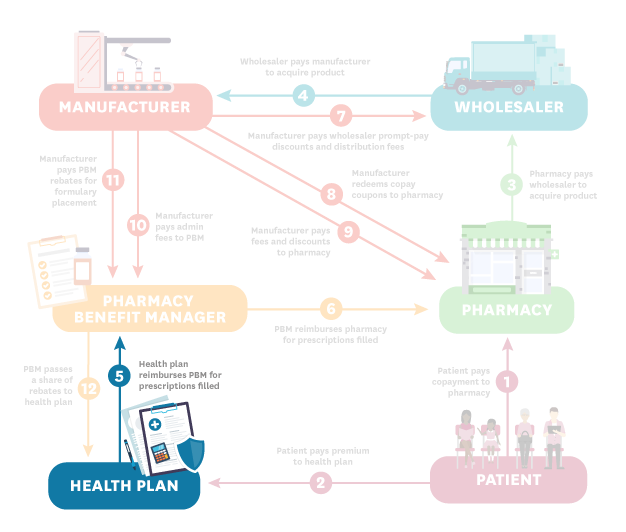
- Health Plan (Step 5): The health plan reimburses the pharmacy benefit manager (PBM) for prescriptions filled.
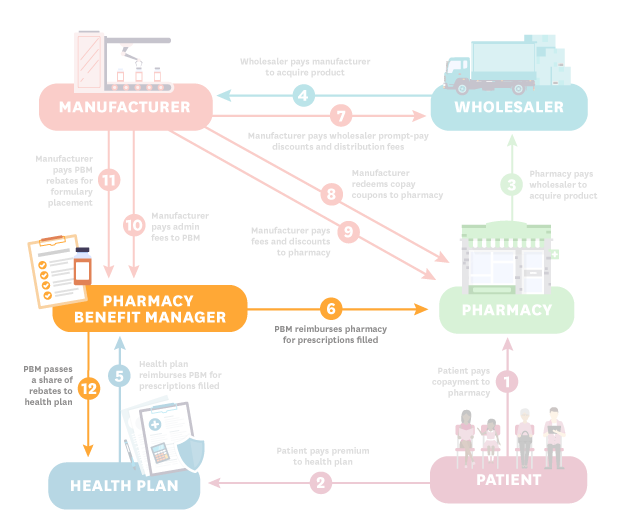
- PBM (Steps 6 and 12): The PBM reimburses the pharmacy for prescriptions filled. The PBM also passes a share of rebates to the health plan.
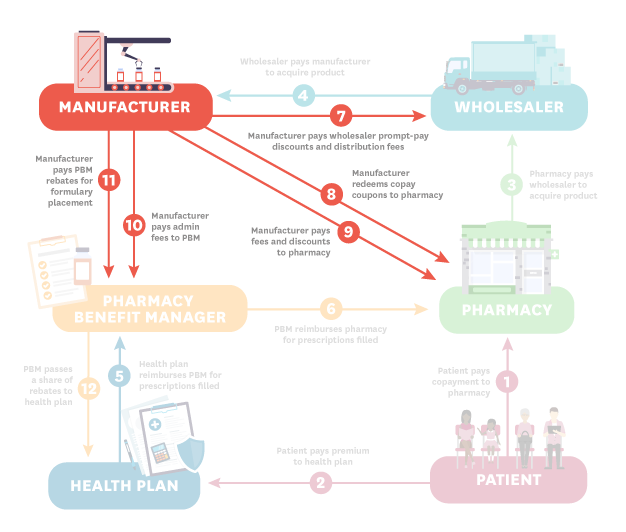
- Manufacturer (Steps 7-11): The manufacturer pays the wholesaler prompt pay discounts and distribution fees (step 7); redeems copay coupons as well as fees and discounts to the pharmacy (steps 8-9); and pays admin fees and rebates to the PBM (steps 10-11).
Net Expenditures Were Flat Between 2014 and 2018
Increasing list prices (the undiscounted “sticker” price set by the manufacturer) have been documented by the media, policymakers and researchers. Along with this trend, decreasing net prices (the price received by manufacturers after discounts, rebates and fees) have also been noted. We confirm the same trends in our data.
We also analyzed net expenditures — the total spent across all distribution system participants, equal to dollar inflows less outflows, summed across all participants.
The graph below shows the average list price, net price and net expenditures per 100 units of insulin for 32 insulin products over time.
We find the gap between list prices and net prices has widened substantially. But net expenditures—the total cost to the health system—have barely changed between 2014 and 2018.
By 2018, More Than Half of Net Expenditures Were Going to Middlemen
We estimated the average share of net expenditures going to each distribution system participant between 2014-2018.
All entities in the distribution system profit from the sale of insulin, and all contribute to its final price. But over the study period, manufacturers' and health plans' shares of total expenditures were shrinking, while PBMs', pharmacies' and wholesalers' shares were growing.
The share of insulin expenditures going to middlemen—PBMs, pharmacies, wholesalers, and health plans—has increased markedly during the study period. In 2014, these intermediaries accounted for 30% of expenditures. By 2018 their share had increased to 53%.
Meanwhile, the share of insulin expenditures going to manufacturers decreased.
Policymakers looking for ways to control insulin costs should consider entities throughout the insulin distribution system. In fact, manufacturers represented a shrinking share of insulin expenditures during the time frame analyzed, while PBMs, pharmacies and wholesalers accounted for a growing share.
Related Work
-
 Data Visualization
The Price of Insulin, Explained
-
 Perspective
Who Is Really Driving Up Insulin Costs?
-

You must be logged in to post a comment.