Key Takeaways:
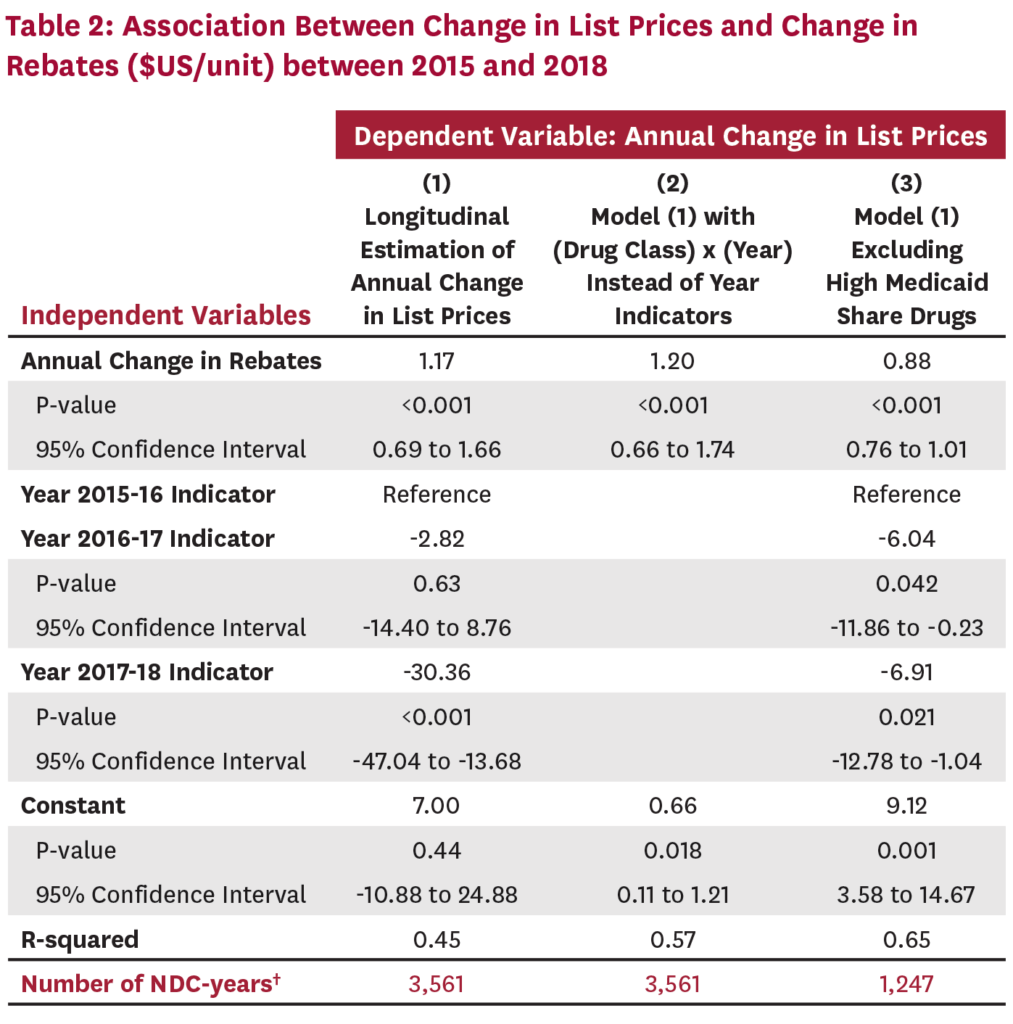
- Drug rebates and list prices are positively correlated: On average, a $1 increase in rebates is associated with a $1.17 increase in list price.
- The relationship between rebates and list prices persists when controlling for time trends by drug class, and when excluding drugs with high Medicaid share.
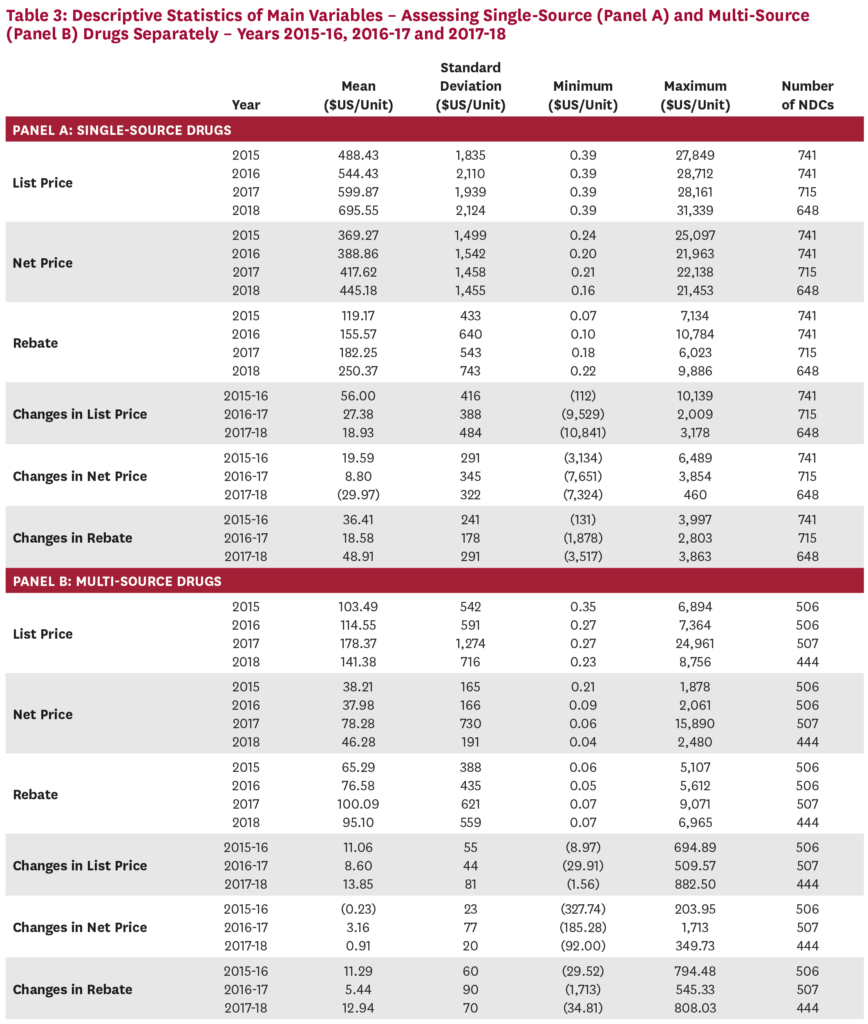
- Single-source drugs have higher average list prices and rebates than multi-source drugs, and show a stronger relationship between changes in rebates and list prices.
- Rebates play a role in increasing drug prices, and reducing or eliminating rebates could result in lower list prices and reduced out-of-pocket expenditures for some patients.
Abstract
Growing divergence between pharmaceutical list and net prices suggest that manufacturer rebates to pharmacy benefit managers (PBMs) and other distribution system intermediaries may play a role in rising drug prices. We analyze new data on list and estimated net prices of U.S. branded pharmaceuticals, finding that, on average, a $1 increase in rebates is associated with a $1.17 increase in list prices. The positive and near 1:1 relationship remains when single-source and multi-source drugs are considered separately (although the effect is smaller and less statistically significant for multi-source drugs), and when drugs with high Medicaid share are excluded. This robust positive relationship suggests that rebates do play a role in increasing list prices, and that reducing or eliminating rebates could lower list prices. Greater transparency throughout the pharmaceutical distribution system would facilitate efforts to better understand drug pricing dynamics and design long-term solutions for anti-competitive practices that increase drug prices.
Background
The roles played by actors in the pharmaceutical system—specifically pharmacy benefit managers (PBMs) and manufacturers—in rising drug prices have recently received much scrutiny in the press and policy circles.[1-5] There is a good reason for this: higher drug prices hurt uninsured patients who pay list prices and insured patients who pay coinsurance and deductibles based on drugs’ list prices.[6] There are two competing ideas about what is driving the increase in list prices. Some argue that manufacturers are solely to blame, as they unilaterally set list prices.[7] Others argue that PBMs share the blame for increasing drug costs because their demands for ever-higher rebates drive manufacturers to raise list prices to maintain profit margins net of those higher rebates.[8] A resolution to this question relies in part on the relationship between list prices and rebates, which can be established empirically.
Understanding the relationship between rebates and list prices is important for several reasons. First, it informs the degree to which efforts to lower drug spending should target manufacturers or others in the distribution system. Second, it illuminates whether policies affecting PBM business practices could lead to lower drug prices and spending. For example, this analysis would inform how a recent proposal to eliminate drug rebates in government programs would affect government and consumer spending.6 Finally, it informs major litigation related to PBM practices such as the recent class action lawsuit alleging that PBMs increased EpiPen costs for consumers by simultaneously increasing rebates and list prices.
Although manufacturers and distribution system entities keep most drug price and rebate information confidential, SSR Health LLC has developed proprietary estimates of these data, based on several publicly available sources.9 Using these estimates, we evaluate the relationship between estimated rebates and list prices empirically.
Data
We used SSR Health’s Rx Brand Pricing Data Tool which provides quarterly U.S. list prices and estimated U.S. net prices of brand drugs representing $380 billion in 2016 sales (about 84 percent of U.S. brand prescription drug sales).[9] The SSR data are compiled from product-level net revenues reported by publicly-traded pharmaceutical firms in financial statements and earnings calls, and product-level unit volumes from third-party data vendors. From the quarterly estimates, we created annual average prices for each drug and calculated the difference between list and estimated net prices for 1,335 U.S. brand prescription drugs by National Drug Code (NDC) from 2015 to 2018. Rebates to PBMs likely account for most of this difference, but other contributors include manufacturer payments and discounts to other intermediaries including wholesalers and pharmacies. For simplicity, we refer to the entire difference as “rebates.”
We also gathered information on whether the brand drugs in our sample had a generic equivalent available at the time, using information from FDA.gov,[10] First Databank,[11] Medicare Part D claims, and web searches. 2,104 NDC-years in our sample are for single-source drugs, and 1,457 NDC-years are for multi-source drugs (those with a generic equivalent available). A drug may switch from single- to multi-source during the study period if generic competition began between 2015 and 2018.
NDCs with annual estimated net price greater than list price were excluded from our final sample, because a net price greater than list price would mean that, instead of manufacturers paying rebates to PBMs, PBMs are paying rebates to manufacturers, which is impossible. We believe that observations where net price exceeds list price represent measurement error in SSR’s estimation methodology that results from rising drug channel inventory levels. Excluding these observations from our analysis did not materially affect our results. Complete details of the sample selection process are provided in appendix Table A1. Tables A2, A3 and A4 in the appendix provide the corresponding results of our analysis on the less restricted sample where we exclude only the 44 NDCs whose list price exceeds net price more than $1,000.
Our final analytic sample thus includes all NDCs appearing in both SSR Health and First Databank datasets in 2015-2018 without negative rebates and for which change in rebates can be calculated.
Finally, we used the 2016 Medical Expenditures Panel Survey (MEPS) to calculate Total Medicaid Expenditure and Total Expenditure by drug class for a nationally representative sample of the US civilian noninstitutionalized population. We used HIC3, a therapeutic drug classification provided by First Databank, to define drug classes. We defined the Medicaid Expenditure Ratio by drug class as (Total Medicaid Expenditure) / (Total Expenditure) on all drugs in each class, and found the distribution of Medicaid Expenditure Ratio for the drug classes that were included in both the SSR Health data analytic sample and MEPS. We classified drugs as having high Medicaid share if they were in drug classes with Medicaid Expenditure Ratio above the 50th percentile (~13 percent).
Results
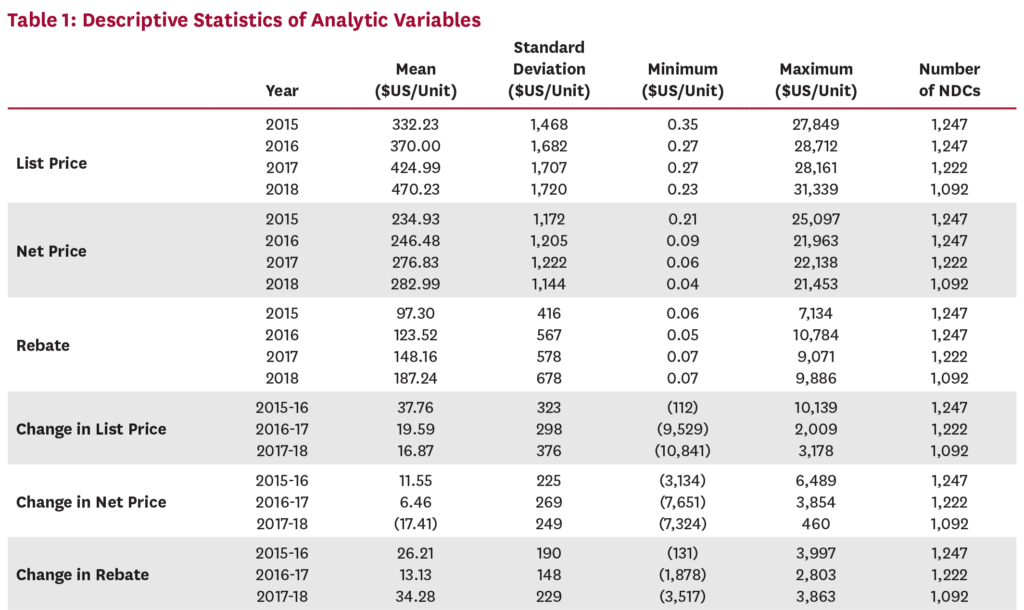
We estimated the relationship between changes in rebates and changes in list price for each NDC over time, using year indicators to control for secular time trends. Table 1 describes our analytic dataset. Table 2 presents our primary results. Linear regression of changes in average list prices on changes in average rebates shows that a $1 increase in rebates is associated with a $1.17 (95% CI [0.69, 1.66] P<0.001) increase in list price (column 1). In column (2) we tested the robustness of our results to differences in time trends by drug class to account for competitive changes that might affect changes in rebates and list price, with qualitatively similar results. In column (3) we excluded drugs with high Medicaid share, since drugs whose list prices increase faster than inflation face mandatory Medicaid rebates. Results were again qualitatively unchanged.
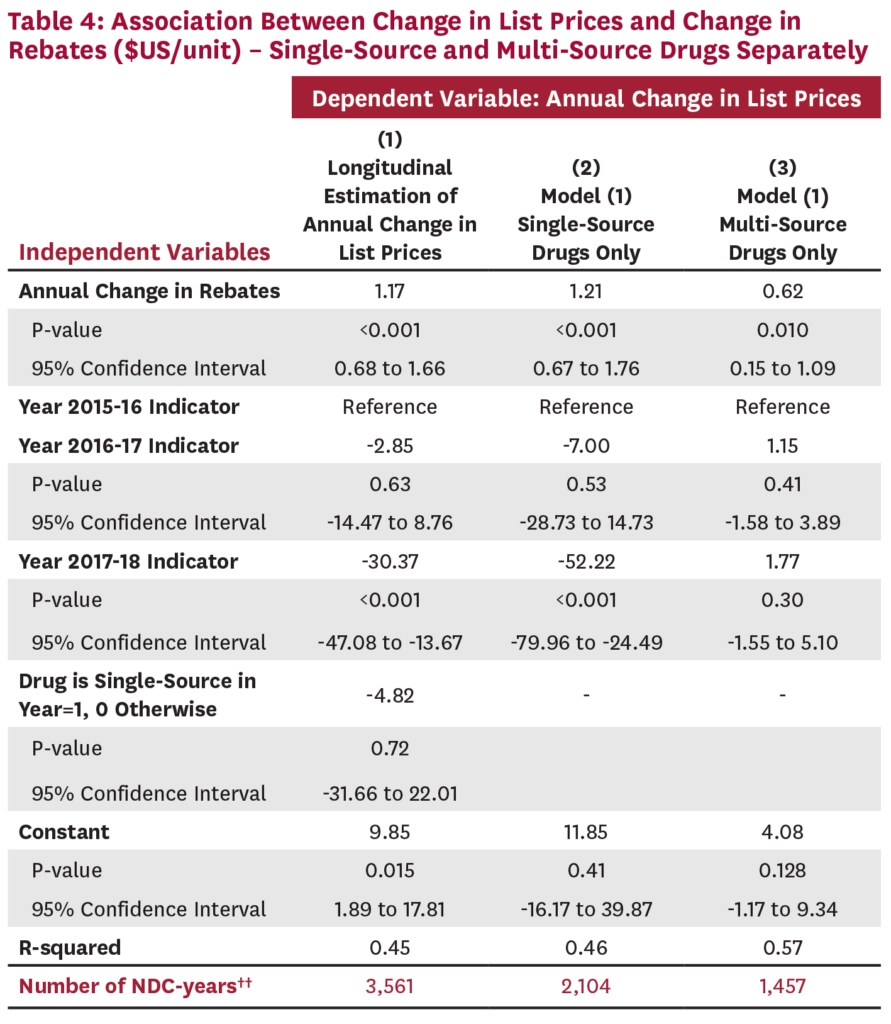
Since brand name drugs with and without generic substitutes face very different competitive forces, we also evaluated the relationship between list prices and rebates on single-source and multi-source drugs separately. Table 3 describes our analytic dataset, with single-source drugs demonstrating higher average list prices, and higher rebates. Table 4 presents the same longitudinal linear model estimated in the first column of Table 2, evaluating single-source and multi-source drugs separately. In column (1), we include an indicator variable that equals one if the drug is single-source. In column (2) and column (3) we estimate the relationship on separate subsamples of single-source and multi-source drugs. In all three specifications, the positive relationship between changes in rebates and changes in list price holds, but more strongly and with greater statistical significance for drugs that do not face generic competition.
Discussion
We find that rebates and list prices are positively related, with an increase in rebates associated with a roughly dollar-for-dollar increase in list price. This suggests that reducing or eliminating rebates could result in lower list prices, thereby decreasing out-of-pocket costs for uninsured patients and for insured patients with deductibles or coinsurance. Any effect on premiums would depend on how reducing rebates changes PBMs’ formulary decisions, whether and how completely PBMs pass rebates on to insurers, and whether and how much insurers share passed-through rebates with consumers. All of these effects are less likely in less competitive PBM or insurance markets.
The positive relationship between list prices and rebates holds for both single-source and multi-source drugs, although it is smaller and less statistically significant for multi-source drugs. Our results suggest that for drugs without generic competition, rebates and list prices move together roughly dollar-for-dollar, resulting in a relatively steady net price. Because manufacturers of brand drugs with a generic equivalent have less market power, a $1 increase in rebates corresponds to a less-than-$1 increase in list price, and a declining net price.
Our finding that increased rebates are positively associated with increased list prices supports the notion that PBMs’ demand for rebates is at least partly responsible for increasing list prices. Because the PBM market is highly concentrated, with three companies serving approximately 80 percent of the market,[12] manufacturers face high stakes when negotiating for formulary placement. If one of the three dominant PBMs excludes their drug, they lose access to a large share of the market, making it all the more important to avoid exclusion from the other two PBMs’ formularies. Offering higher rebates is an important lever that manufacturers can use to reduce the chance of being excluded. This dynamic can drive the perverse result in which PBM formularies favor drugs that offer higher rebates over similar drugs with lower net costs and lower rebates.[13]
Policy solutions that increase transparency throughout the distribution system would enable a better understanding of how rebates and drug prices are related, thereby ensuring that profits throughout the system are rewarding value-adding activities, rather than anti-competitive ones.
Several limitations constrain our analysis. Although SSR net price estimates are used in high-stakes investment decisions by Wall Street banks and in drug value assessments by the Institute for Clinical Effectiveness Research,[14,15] the data have not been formally validated. A second limitation is that estimated rebates in SSR data also include concessions to all supply chain participants, which could weaken our estimates or cloud their interpretation. Further research addressing these limitations and the dynamics that drive rebate and pricing decisions and PBM formulary placement is needed.
Conclusion
We find that increases in rebates are associated with a roughly dollar-for-dollar increase in list prices, and conclude that the rebate practices of intermediaries such as PBMs and insurers deserve greater regulatory scrutiny in the quest for lower drug prices. Greater transparency about the use of rebates and potential efforts to reduce them may prove important tools for controlling the cost of pharmaceuticals.
A press release about this white paper is available here.
References
1. U.S. Senate Committee on Finance. A Tangled Web: An Examination of the Drug Supply and Payment Chains. 2018 Jun [cited 2019 Apr 23]; Available from: https://www.finance.senate.gov/imo/media/doc/A%20Tangled%20Web.pdf.
2. U.S. Department of Health and Human Services. American Patients First: The Trump Administration Blueprint to Lower Drug Prices and Reduce Out-of-Pocket Costs. 2018 May [cited 2019 Nov 20]; Available from: https://www.hhs.gov/sites/default/files/AmericanPatientsFirst.pdf.
3. Langreth, R., D. Ingold, and J. Gu. The Secret Drug Pricing System Middlemen Use to Rake in Millions. Bloomberg 2018 Sep [cited 2019 Nov 20]; Available from: https://www.bloomberg.com/graphics/2018-drug-spread-pricing/.
4. Schladen, M. Reports Show Pharmacy Middlemen Making Big Money in Other States. The Columbus Dispatch 2019 Mar [cited 2019 Nov 20]; Available from: https://www.dispatch.com/news/20190314/reports-show-pharmacy-middlemen-making-big-money-in-other-states.
5. Levy, S. West Virginia Medicaid Saves $54.4M with Prescription Drug Carve Out. Drug Store News 2019 Mar [cited 2019 Nov 20]; Available from: https://drugstorenews.com/pharmacy/west-virginia-medicaid-saves-54-4-million-with-prescription-drug-carve-out.
6. U.S. Department of Health and Human Services. Fraud and Abuse; Removal of Safe Harbor Protection for Rebates Involving Prescription Pharmaceuticals and Creation of New Safe Harbor Protection for Certain Point-of-Sale Reductions in Price on Prescription Pharmaceuticals and Certain Pharmacy Benefit Manager Service Fees. Federal Register 2019 Feb [cited 2019 Apr 23]; 84(25): Available from: https://www.govinfo.gov/content/pkg/FR-2019-02-06/pdf/2019-01026.pdf.
7. Roy, A. Drug Companies, Not ‘Middlemen’, Are Responsible For High Drug Prices. 2018 Oct [cited 2019 Apr 23]; Available from: https://www.forbes.com/sites/theapothecary/2018/10/22/drug-companies-are-responsible-for-high-drug-prices-not-middlemen/#1ae50c254947.
8. Shepherd, J., Pharmacy Benefit Managers, Rebates, and Drug Prices: Conflicts of Interest in the Market for Prescription Drugs. Yale Law Policy Rev, 2019 Jan. 1(38).
9. SSR Health L.L.C. US Prescription Brand Net Pricing Data. Available from: https://www.ssrhealth.com/.
10. U.S. Food and Drug Administration. Available from: https://www.fda.gov/.
11. First Databank. FDB MedKnowledge Drug Pricing. Available from: https://www.fdbhealth.com/.
12. Bai, G., A.P. Sen, and G.F. Anderson, Pharmacy Benefit Managers, Brand-Name Drug Prices, and Patient Cost Sharing. Annals of Internal Medicine, 2018. 168(6): p. 436-437.
13. Ornstein, C. and K. Thomas. Take the Generic, Patients Are Told. Until They Are Not. The New York Times 2017 Aug [cited 2019 Nov 20]; Available from: https://www.nytimes.com/2017/08/06/health/prescription-drugs-brand-name-generic.html.
14. Institute for Clinical and Economic Review. Final Value Assessment Framework for 2017-2019. [cited 2019 Nov 20]; Available from: https://icer-review.org/final-vaf-2017-2019/.
15. Institute for Clinical and Economic Review. ICER’s Reference Case for Economic Evaluations: Principles and Rationale. 2018 Jul [cited 2019 Nov 20]; Available from: http://icer-review.org/wp-content/uploads/2018/07/ICER_Reference_Case_July-2018.pdf.
You must be logged in to post a comment.