The average change was similar to nonsystem hospitals
Schaeffer Center White Paper Series | DOI: 10.25549/sxzq-3s27
Policy Context
A large body of academic research indicates that hospital market concentration—and integration with other types of providers—results in higher prices. The natural conclusion is that regulators should resist hospital mergers—or the creation of larger hospital and health systems—in an effort to limit market power, restrain unnecessary price growth and protect consumers from harm.
However, there is evidence that system membership—where two or more hospitals are owned, leased, sponsored or managed by a central organization—can also benefit consumers. Historically, these potential benefits have included improved operating efficiencies, shared clinical and managerial expertise, and helping facilitate the transition to value-based payment arrangements. More recently, the COVID pandemic revealed that system membership can also enable hospitals to better respond to fluctuating staffing and resource allocation needs compared to independent hospitals.
Our study of price changes among California hospitals from 2012 through 2018 found that the relationship between system membership and price growth is much more nuanced than past research might suggest. In contrast to the simplistic notion that concentration—and therefore system membership—unilaterally drives higher hospital prices, we instead found that, while some systems exhibited very high price growth, others exhibited very modest price growth. Regulators faced with evaluating a hospital transaction, therefore, should undertake analysis that does not presume consumer harm when predicting the impact of system membership.
More research is needed to evaluate these relationships more broadly, as well as to better understand the drivers of the variation in hospital price growth that we observed. But, for regulators, our findings underscore the importance of weighing the potential harms and benefits to consumers of specific transactions. That is, simply applying averages could miss important variation and misstate the implications of individual transactions related to both efficiency gains and increased market power. Moreover, evaluations of these transactions should acknowledge that there is also a public health interest in regulatory policy that supports resilient hospitals—that is, hospitals that can rapidly adapt and sustain effective operations during public health emergencies or natural disasters.
Key Takeaways
- Between 2012 and 2018, the average risk-adjusted price per patient discharge among all California hospitals increased by 2.4% per year.
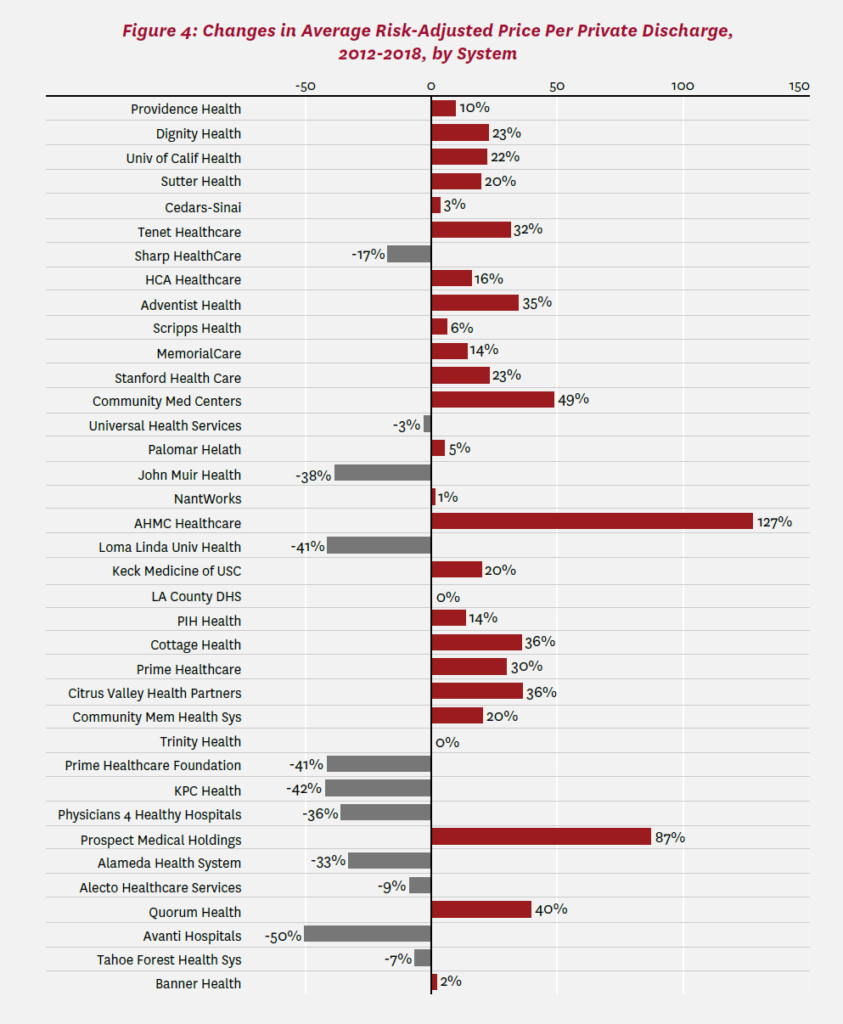
- Overall, price growth was similar across system and nonsystem hospitals, but there was wide variation across hospital systems, ranging from price decreases to increases as high as 14.7% per year (+127% over the entire study period).
- Average price growth was high among for-profit systems (31% over the study period), while non-profit and public systems had lower average price growth (13%) than nonsystem hospitals (15%).
A press release covering this white paper’s findings is available here.
Abstract
Growth of hospital systems in the U.S., while drawing regulatory scrutiny, may facilitate cost savings due to efficiencies, thereby potentially benefiting patients. At the same time, substantial evidence suggests that hospital mergers raise prices. We evaluated data from California’s Department of Health Care Access and Information to compare recent changes in prices between system and nonsystem hospitals in California. We found that increases in average risk-adjusted price per discharge were similar among system and nonsystem hospitals overall from 2012 through 2018. However, there was significant variation in price growth across different types of hospital systems. Price growth was particularly high among hospitals belonging to for-profit systems. In contrast, price growth among hospitals in non-profit and public systems was lower than nonsystem hospitals.
Introduction
Hospital systems in the United States have grown substantially over the last few decades.1,2 This consolidation has generated significant regulatory scrutiny but also provides empirical evidence that hospitals possess financial incentives for joining systems. While consolidation could be driven by hospital incentives to improve their bargaining position vis-àvis insurers, it may also facilitate cost savings through increases in scale.3
System membership may result in operating efficiencies that stem from volume discounts on supplies, reductions in redundant cost centers and other factors. A number of studies have investigated whether hospital consolidation results in reduced hospital costs.4-8 For example, a recent study of U.S. hospital mergers from 2000 to 2010 found that acquired hospitals may experience reductions in the cost of providing care on the order of 5%.7 The study further finds that costs are lower when the acquirer is a system that operates multiple hospitals, but not when the acquirer is an independent operator. The mechanisms through which such cost savings are realized were not conclusively determined.
System membership could benefit hospitals and their patients through shared clinical and managerial expertise. For example, clinical standardization, predictive analytics, and treatment guidelines and processes can help reduce the significant costs associated with outlier patients.9 Hospital executives have also asserted the importance of system membership in helping facilitate hospitals’ transition to modern, value-based payment arrangements and bolstering the industry’s capacity to effectively respond to the COVID-19 pandemic.3,10
If such benefits are realized, then, they must be weighed against the potential harms to consumers from the higher prices negotiated by hospitals in more concentrated markets.11 Perhaps more relevant than the association between the levels of hospital market concentration and hospital prices, though, is the change in those prices and, specifically, whether system membership is related to price trajectories. Studies analyzing older data have found that prices increased more rapidly among hospitals in systems relative to independent hospitals and, in particular, among hospitals that consolidated with their geographically proximal competitors.11,12 Studies evaluating trends in more recent years are limited, and significant changes in the reimbursement landscape and implementation of the Patient Protection and Affordable Care Act over the past decade suggest the need for updated analysis.
In this white paper, we evaluate data from California’s Department of Health Care Access and Information (HCAI) to compare recent changes in hospital prices between system and nonsystem hospitals in the state. Additionally, we explore variations in these changes across systems and system types.
Study Data and Methods
We quantify the change in prices paid to acute care hospitals—both those in systems and those not in systems—throughout the state of California from 2012 through 2018. We focus on the prices paid by health insurers for private (that is, commercial) health plans, because in this case insurers negotiate prices with hospitals (in contrast, Medicare and Medi-Cal programs set prices administratively).a We therefore need to characterize hospital prices and system membership.
To measure prices, we follow the literature in exploiting financial data collected, audited and disseminated by HCAI.12-16 In particular, we use the calendar-year version of hospitals’ annual financial reports.17 These reports detail finances (including revenues) and utilization (including inpatient admissions, stays and discharges).
A strength of these data is that finances and utilization are disaggregated by broad source/category—for example, traditional (fee-for-service) Medicare. For private coverage, we use the category “other third parties,” including fee-for-service and managed-care contracts. Another strength of the data is that revenues are reported as net of deductions from revenue—in particular, net of the contractual discounts that these insurers typically negotiate from service-specific “charges.” Such discounts are proprietary information and are not reported for individual insurers but only in the aggregate for all insurers within a given category. Net revenue is reported inclusive of outpatient as well as inpatient care, and we follow the literature in measuring net inpatient revenue by scaling net revenue by the inpatient share of gross revenue (again for other third parties). In rare instances, net revenues at the hospital-year level were measured to be negative and were set to zero. For each hospital in each year, price per discharge is net revenues divided by the number of private-pay discharges. Kaiser Permanente hospitals did not report financial information and were excluded.b
A challenge of this analysis is adjusting prices for the fact that hospitals treat mixes of patients with different conditions and severity of illness. For example, hospital A may treat patients who are sicker or in need of more resource-intensive care than hospital B. Hospital A may receive a higher price, but possibly only because its patients are sicker and not because of other factors, such as bargaining power. The healthcare literature has generally dealt with this issue by “risk adjusting” for the “case mix” of patients or by narrowly focusing on a similar type of patient condition (e.g., heart attack). Rather than focusing on a limited set of diagnoses underlying hospital admission,12 we include all admissions but construct and apply a case-mix index.
To do so, we exploit HCAI’s case-mix index.18 Based on clinical information, each hospital admission is assigned a diagnosis-related group (DRG). These groups were developed for Medicare to reimburse hospitals a flat fee for each type of patient, intended to be sufficient for an efficient hospital to cover the cost of treating the patient type. For this purpose, each DRG is assigned a weight that reflects the resource use needed to treat the patient type, compared to other types of patients. The HCAI case-mix index averages DRG weights across all admissions at each hospital in each fiscal year. We then calculate a calendar-year version.c A higher index indicates that a hospital’s patients required more resources on average.
The average price per private discharge for each hospital year is adjusted for (specifically, divided by) the value of this index. At the level of hospital types (e.g., for-profit system) and specific systems, price changes are weighted by the number of private discharges in 2018 for each hospital year. Weighting ensures that high-volume hospitals “count for more” than low-volume ones, and the result is thus more reflective of discharges themselves rather than hospital organizations. We focus on average changes between 2012 and 2018, while also considering median changes.d
Finally, to identify hospital systems, we follow the definition of the American Hospital Association (AHA)—namely, “a multihospital health care system is an entity with two or more hospitals owned, leased, sponsored or contract managed by a central organization.”20 AHA conducts annual surveys of the large majority of U.S. hospitals, and system membership is reported. In cases of ambiguity, we verify system membership based on public reporting. We treat a California hospital that was the sole system member within the state as a system hospital. We identify systems as of 2018. In sensitivity analysis, we exclude hospitals that joined, left or switched systems during the study window.
Because the literature on hospital pricing has addressed the issue of cross-market mergers (particularly recently),7,21,22 we report the number of California counties in which each system has operated. The literature has considered a variety of definitions for hospital markets, including counties as an intermediate geography in terms of size.7,23 We also address the type of ownership (as reported in HCAI annual financial disclosures) and the size of the system (based on the total number of private discharges in California in 2018). Additional methodological details are provided in the appendix.
Study Results
Table 1 identifies hospital systems operating in California as of 2018. These 37 systems varied in size, with an average of 13,330 private-pay (that is, commercial) discharges in 2018.e The two largest were Providence Health and Dignity Health, with 61,620 and 53,254 discharges, respectively, at system hospitals within California in 2018.f Providence Health and Dignity Health had 17 and 30 member hospitals, respectively. The average was 5.4 hospitals, and most systems had three or fewer hospitals. Prime Healthcare, a growing health system in the Los Angeles area that has attracted significant attention from industry observers,24 had 7 hospitals. The number of counties in which these systems operated during the study window (2012 through 2018) varied from one (21 systems) to 20 (Dignity Health) out of a possible 58 California counties. The appendix lists the hospitals in each system as well as other attributes, including location, number of discharges, ownership type and state ID number.
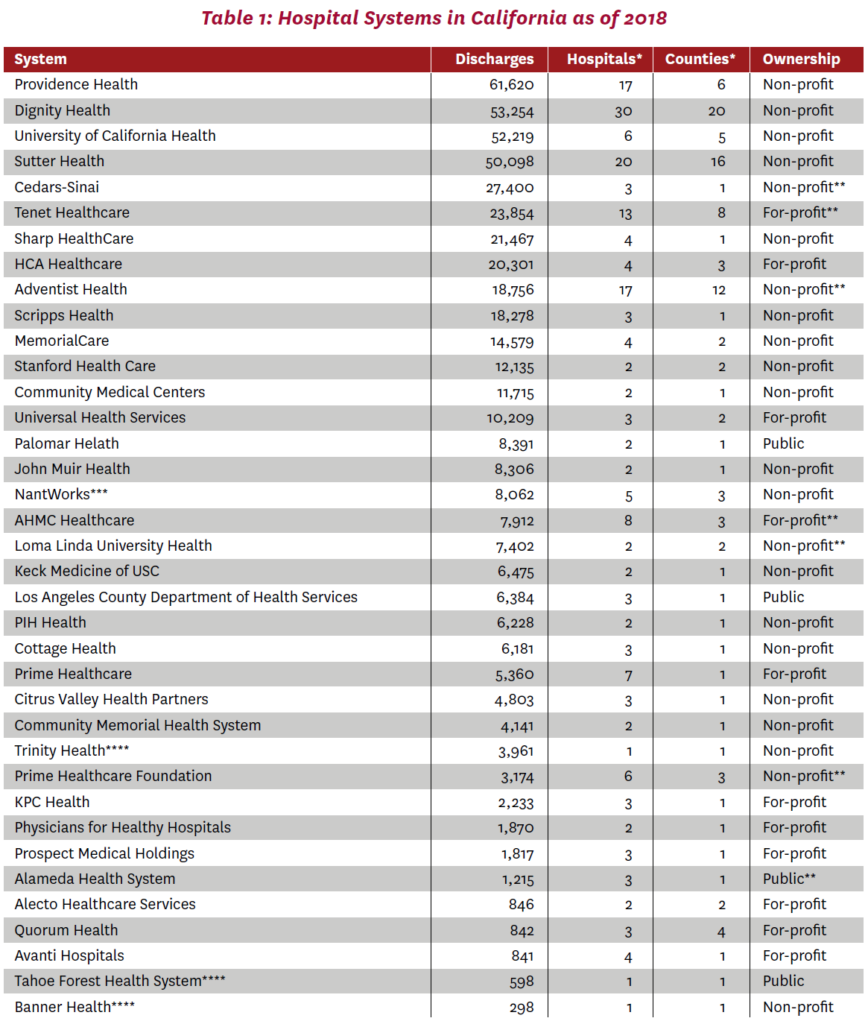
Note: Excludes Kaiser Permanente, for which financial data were unavailable. All variables as of 2018 except * refers to any year within the 2012-2018 study window. Sorted by number of private-pay (commercial) discharges in 2018 at hospitals belonging to 2018 system.
**Hospital part of 2018 system changed ownership type within 2012-2018 study window. Ownership type was consistent within each system as of 2018, except that St. Rose (OSHPD ID 010967) at Alecto Healthcare Services and Parkview Community Hospital (OSHPD ID 331293) at AHMC Healthcare were reported to be non-profit. These hospitals were treated according to their reported ownership types in the analysis.
***Formerly operating as Daughters of Charity Health System and Verity Health System.
****Other system members located outside California.
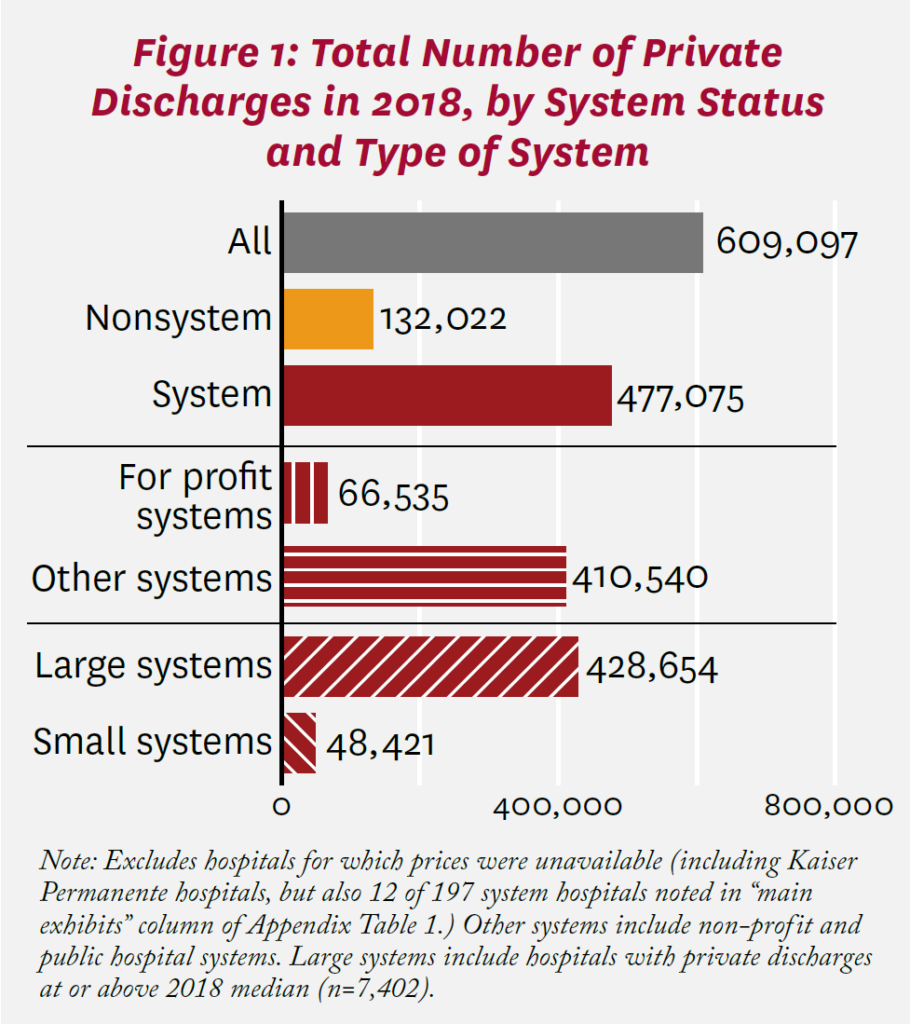
Figure 1 shows the number of private patients discharged from California hospitals in 2018, according to system status and system type. Of 609,097 discharges with measured price changes, 477,075 were at system hospitals. Among system hospitals, most discharges were from non-profit or public hospitals (410,540), rather than for-profit facilities. Most were also from large (median or higher in total private discharges in 2018) hospitals (428,654).
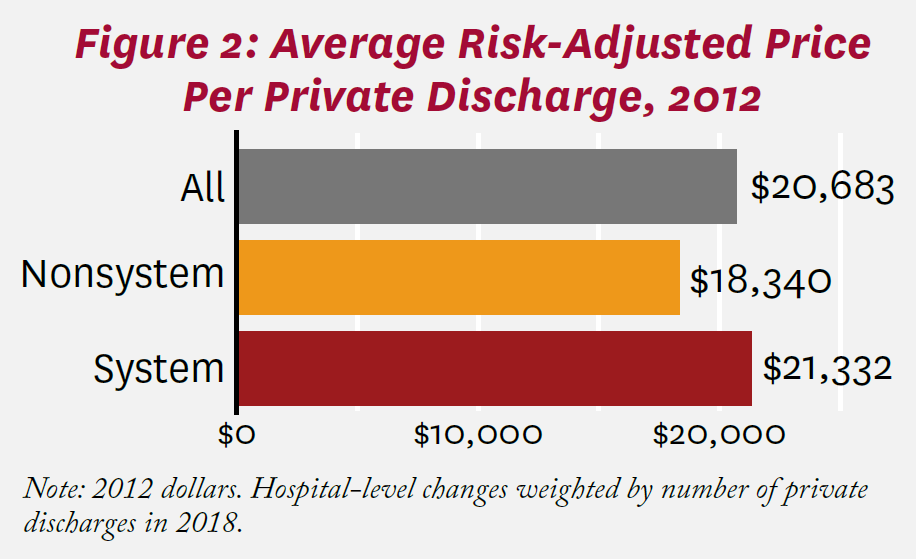
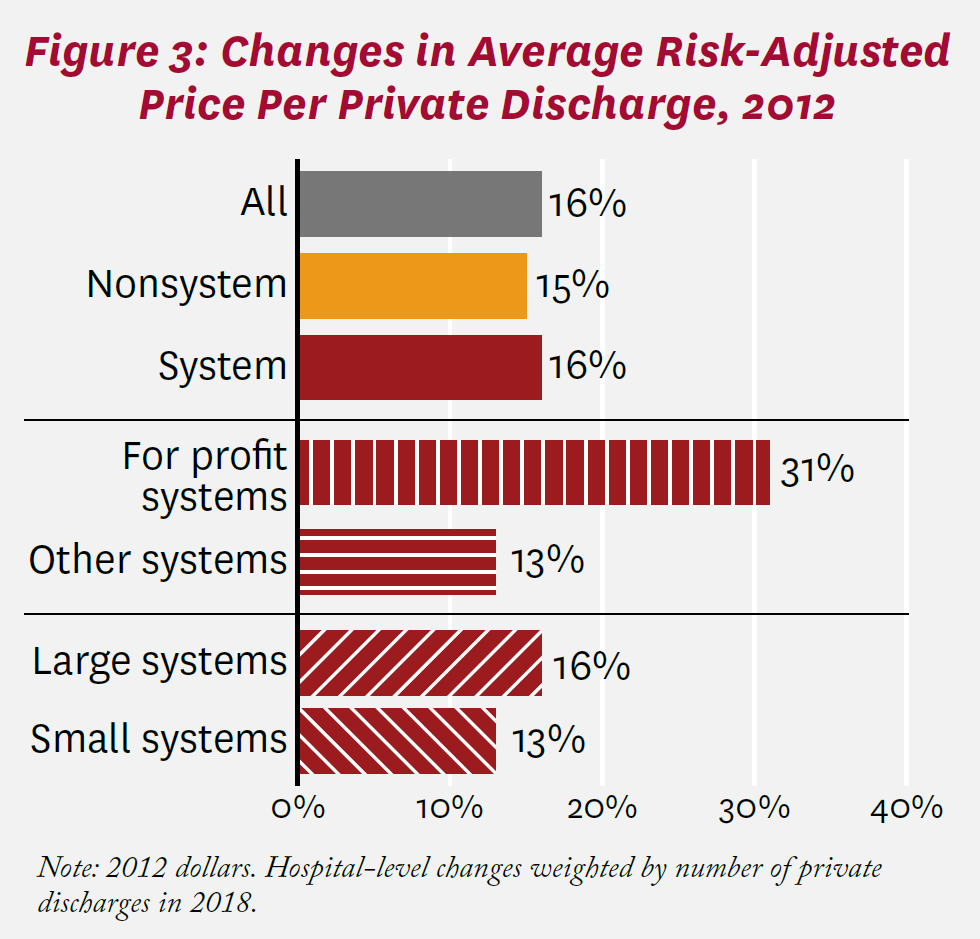
Average risk-adjusted prices per private discharge at California hospitals as of 2012 are shown in Figure 2. Among all hospitals, the price per discharge was $20,683. The average price was $18,340 at nonsystem hospitals compared to $21,332 at system hospitals, a 16% difference. Between 2012 and 2018, the average price among all California hospitals increased by 16%, as shown in Figure 3. Increases in average risk-adjusted price per discharge were similar among system and nonsystem hospitals (16% and 15%, respectively). Among system hospitals, price increased substantially more among for-profit hospitals (11 total, including Tenet Healthcare and Prime Healthcare) than among non-profit and public hospitals (31% and 13%, respectively).g Prices also increased more at larger systems than smaller ones (16% and 13%, respectively), though the difference (+3%) was more muted than with respect to ownership.
Figure 4 compares price changes across systems. Sutter Healthcare, a large non-profit system in Northern and Central California that has been scrutinized by antitrust authorities and other policymakers,25 saw an increase in risk-adjusted price per private discharge of 20%. Price increased the most at AHMC Healthcare’s eight hospitals, specifically, by 127% overall, or 14.7% per year (geometric mean), 2012 to 2018. Average price decreased for 13 of 37 systems, with the largest decrease at Avanti Hospitals (-50%). Among large systems, Loma Linda University Health saw the largest decrease (-41%). Without risk adjustment, price changes would have been more positive in general; our case-mix index increased by +15% between 2012 and 2018.
When we consider median changes, price increases were smaller for all hospitals (+9%, versus +16% based on the average), nonsystem hospitals (+6% versus +15%) and system hospitals (+10% versus +16%), as reported in the appendix. This pattern suggests that average change may have been driven to a meaningful extent by hospitals (overall, and within systems and nonsystems) with large increases in prices. With respect to ownership, prices at hospitals belonging to for-profit systems continued to increase more than hospitals at other systems (+12% versus +8%). The smaller gap here suggests that price increases may have been larger or more common at for-profit systems. Again, based on median prices, prices increased substantially more at small systems than at large ones (+18% versus +9%, respectively).
When hospitals whose system status changed are excluded, average price changes are comparable to Figure 3, as again reported in the appendix. These sensitivity analyses are also reported at the system level in the appendix.h
Discussion
This study assessed changes in the prices that California hospitals received for caring for individuals with private health insurance over the period 2012 through 2018, with a particular focus on 37 hospital systems operating in the state. Overall, after accounting for the mix of patients treated, system hospitals experienced somewhat higher increases in average price per discharge than nonsystem hospitals (+16% versus +15%, respectively). Notably, these changes do not take account of inflation in the broader economy. On an annualized basis, the prices paid by private insurers per admission to nonsystem and system hospitals in California increased by +2.3% and +2.5% per year, respectively. The higher growth among system hospitals was driven by for-profit systems; for those hospitals affiliated with non-profit or public systems, price changes were slightly smaller (+2.1% per year) than at nonsystem hospitals.
For context, national spending on hospital care increased by 28% (more than 4% per year) during this period.26 This growth rate includes all patients (in terms of geographic location and insurance coverage) and all kinds of services provided by hospitals (including, for example, psychiatric care, outpatient surgery, and skilled nursing and other post-acute care when hospital based).26 Payments by private insurance plans (not including beneficiary out-of-pocket costs) comprised roughly $4 out of every $10 paid by insurers to hospitals.26
We also documented wide variation in price changes among hospital systems. Overall changes in average price per discharge over the 2012-2018 window ranged from negative and substantial (-50% at Avanti) to positive and quite substantial (+127% at AHMC Healthcare). This variation was obscured in a recent study that compared prices at two large systems in California (Sutter Health and Dignity Health) to all other hospitals, including other systems.16
These pricing differentials among systems, and those between system and nonsystem hospitals, may stem from a variety of factors, including market competition and concentration, costs and organizational mission. As noted previously, hospitals in highly concentrated markets can negotiate relatively high prices from private insurers.i When hospitals within the same geographic market participate in a system, concentration increases. Some hospital systems in California operate in a single county—one definition of a hospital market—while others are dispersed across numerous counties. Quantifying the precise role of market concentration on California hospital pricing is beyond the scope of this study, but a worthwhile direction for further inquiry.
Nevertheless, any contribution of hospital systems to increasing market concentration during the period studied cannot itself explain the relatively slow price growth that we find among hospitals that belonged to non-profit (or public) systems. A partial explanation may be that system participation sometimes helps limit cost growth through economies of scale in purchasing, administration and expensive medical technologies. Consistent with this hypothesis, a recent analysis of the U.S. hospital sector from 2000 to 2010 found that hospitals that were acquired experienced cost reductions on the order of 5% (acquirers did not themselves achieve cost savings).7 This study also found that length of stay decreased at hospitals that were acquired; our study documents that length of stay increased more for nonsystem discharges than system discharges in California over 2012 to 2018.
In both California and the U.S., non-profit hospitals are far more numerous than for-profit hospitals.28 It is possible that the mission of non-profit hospitals is not merely financial. Indeed, non-profit hospitals are ostensibly required to provide “community benefit” (such as health services for underserved groups) to qualify for tax exemptions.j It is perhaps not coincidental that hospital systems operating in California on a for-profit basis exhibited relatively high rates of price growth. There is a longstanding debate about the role of ownership form in the hospital sector,28-30 and this pattern among for-profit systems, while not resolving this debate, is relevant to it.
Disclosure Statement:
Support for this white paper was provided by the USC Leonard D. Schaeffer Center for Health Policy & Economics and a gift from Cedars-Sinai. The USC Schaeffer Center is funded by foundations, corporations, government agencies, individuals and an endowment; a complete list of sponsors can be found in our annual reports (available here). The views expressed herein are those of the authors and do not represent the views of the Schaeffer Center nor its sponsors. Romley has served as a consultant to government and to industry relating to the pharmaceutical sector. Choi has served as a consultant to QuantHealth. Trish has served as a consultant and litigation expert on matters in the hospital, health insurance, health information technology and life sciences sectors. Lakdawalla reports personal fees or research support from Amgen, Biogen, Genentech, GRAIL, Edwards Lifesciences, Novartis, Otsuka, Perrigo, and Pfizer and holds equity in Precision Medicine Group, which provides consulting services to firms in the life sciences.
The Schaeffer Center White Paper Series is published by the Leonard D. Schaeffer Center for Health Polic & Economics at the University of Southern California. Papers published in this series undergo a rigorous peer review process, led by the Director of Quality Assurance at the USC Schaeffer Center. This process includes external review by at least two scholars not affiliated with the Center.
Footnotes
- a. Hospital prices paid by private plans operating in these public programs (i.e., Medicare Advantage and Medicaid managed-care plans) tend to reflect the administratively set rates for their respective public programs rather than prices negotiated by commercial insurers.
- b. Kaiser Permanente reported 193,035 private admissions at 31 hospitals in its 2018 annual financial disclosures to HCAI.
- c. For example, we calculated the calendar year 2012 value for a hospital as three-quarters of the fiscal year 2012 value and one-quarter of the fiscal year 2013 value. We assessed the relationship between this all-payer case mix and the case mix of private patients using discharges with private coverage as the expected source of payment in HCAI’s 2012 Patient Discharge Data,19 and found a correlation coefficient of +0.90 across hospitals in the present analysis.
- d. For example, we calculated the calendar year 2012 value for a hospital as three-quarters of the fiscal year 2012 value and one-quarter of the fiscal year 2013 value. We assessed the relationship between this all-payer case mix and the case mix of private patients using discharges with private coverage as the expected source of payment in HCAI’s 2012 Patient Discharge Data,19 and found a correlation coefficient of +0.90 across hospitals in the present analysis.
- e. The size of the California systems studied here was comparable to the size of systems operating entirely outside of California. Based on the AHA survey, the median number of total admissions (admtot) in 2018 to all California hospitals belonging to a system operating in California was 32,844, versus 36,220 to all hospitals belonging to systems operating entirely outside of California.
- f. Fallbrook Hospital District (OSHPD ID 370705) is the only hospital that ever belonged to a system that operated in 2018 but did not itself operate in 2018. The facility ceased providing inpatient care in 2014.
- g. Average price increases were smaller at public hospitals compared to non-profit ones (+0.6% versus +13.9%), but the former comprised only 4% of private admissions at non-profit hospitals in 2018.
- h. Median price decreased by 100% for the non-profit Prime Healthcare Foundation because risk-adjusted (net) revenues were measured to be negative in 2018, and set to zero, at Encino Hospital Medical Center (OSHPD ID 190280). A similar adjustment was made for Prime Healthcare’s Garden Grove Hospital and Medical Center (OSHPD ID 301283).
- i. Concentration among health insurers also impacts the rates paid to hospitals.27 An integrated system (such as Kaiser Permanente) acts as both provider and insurer.
- j. In addition, teaching hospitals train doctors and are typically non-profit.
References
- Gaynor, M., and R. Town. (2011). Competition in Health Care Markets. Handbook of Health Economics, vol. 2, edited by Mark V. Pauly, Thomas G. Mcguire and Pedro Barros, 499-637. Amsterdam: Elsevier.
- Cutler, D. M., and F. Scott Morton. (2013). Hospitals, Market Share and Consolidation. JAMA, 310 (18): 1964-70.
- Antitrust Applied: Hospital Consolidation Concerns and Solutions. (2021). Subcommittee on Competition Policy A and Consumer Rights of U.S. Senate Judiciary Committee, May 19. Rodney Hochman, President and CEO, Providence, and Chair of the American Hospital Association.
- Dranove, D., and R. Lindrooth. (2003). Hospital Consolidation and Costs: Another Look at the Evidence. Journal of Health Economics, 22 (6): 983-97.
- Burns L. R., J. S. McCullough, D. R. Wholey, G. Kruse, P. Kralovec and R. Muller. (2015). Is the System Really the Solution? Operating Costs in Hospital Systems. Medical Care Research and Review, 72 (3): 247-72.
- Harrison, T. D. (2011). Do Mergers Really Reduce Costs? Evidence From Hospitals. Economic Inquiry, 49 (4): 1054-69.
- Schmitt, M. (2017). Do Hospital Mergers Reduce Costs? Journal of Health Economics, 52: 74-94.
- Prager, E., and M. Schmitt. (2021). Employer Consolidation and Wages: Evidence From Hospitals. American Economic Review, 111 (2): 397-427.
- Noether, M., and S. May. (2017). Hospital Merger Benefits: Views From Hospital Leaders and Econometric Analysis. Charles River Associates. https://www.aha.org/system/files/2018-04/Hospital-Merger-Full-Report-FINAL-1.pdf.
- Noether, M., B. Stearns and S. May. (2019). Comments on Cooper et al., “Hospital Prices Grew Substantially Faster Than Physician Prices for Hospital-Based Care in 2007–14.” Charles River Associates. https://www.crai.com/insights-events/publications/comments-cooper-et-al-hospital-prices-grew-substantiallyfaster-physician-prices/.
- Cooper, Z., S. V. Craig, M. Gaynor and J. Van Reenen. (2019). The Price Ain’t Right? Hospital Prices and Health Spending on the Privately Insured. Quarterly Journal of Economics, 134 (1): 51-107.
- Melnick, G., and E. Keeler. (2007). The Effects of Multihospital Systems on Hospital Prices. Journal of Health Economics, 26 (2): 400-13.
- Keeler, E. B,. G. Melnick and J. Zwanziger. (1999). The Changing Effects of Competition on Non-profit and For-profit Hospital Pricing Behavior. Journal of Health Economics, 18 (1): 69-86.
- Lynk, W. J. (1995). Nonprofit Hospital Mergers and the Exercise of Market Power. Journal of Law & Economics, 38
(2): 437-61. - Burgess J. F. Jr., K. Carey and G. J. Young. (2005). The Effect of Network Arrangements on Hospital Pricing Behavior. Journal of Health Economics, 24 (2): 391-405.
- Melnick, G. A., K. Fonkych and J. Zwanziger. (2018). The California Competitive Model: How Has It Fared, and What’s Next? Health Affairs, 37 (9): 1417-24.
- California Department of Health Care Access and Information. (2022). Hospital Financials. https://hcai.ca.gov/data-and-reports/cost-transparency/hospital-financials.
- California Department of Health Care Access and Information. (2022). Case Mix Index. https://data.chhs.ca.gov/dataset/case-mix-index.
- California Department of Health Care Access and Information. (2022). 2020 Data Documentation. https://hcai.ca.gov/data-and-reports/request-data/data-documentation.
- American Hospital Association. (2021). AHA Annual Survey Database. https://www.ahadata.com/aha-annual-survey-database.
- Lewis, M. S., and K. E. Pflum. (2015). Diagnosing Hospital System Bargaining Power in Managed Care Networks. American Economic Journal: Economic Policy, 7 (1): 243-74.
- Dafny, L., K. Ho and R. S. Lee. (2019). The Price Effects of Cross-Market Mergers: Theory and Evidence From the Hospital Industry. RAND Journal of Economics, 50 (2): 286-325.
- Morrisey, M.A., F. A. Sloan and J. Valvona. (1988). Defining Geographic Markets for Hospital Care. Law and Contemporary Problems, 51 (2): 165-94.
- Pfeifer, S. (2015). Hospital Chain Prime Healthcare Faces a Fight to Grow. Los Angeles Times, February 1.
- Li, R., and C. Ho. (2019). “A Huge Deal”: Sutter to Pay $575 Million in Antitrust Settlement. San Francisco Chronicle, December 20.
- Centers for Medicare and Medicaid Services. (2021). National Health Expenditure Data. https://www.cms.gov/Research-Statistics-Dataand-Systems/Statistics-Trends-and-Reports/NationalHealthExpendData.
- Trish, E. E., and B. J. Herring. (2015). How Do Health Insurer Market Concentration and Bargaining Power With Hospitals Affect Health Insurance Premiums? Journal of Health Economics, 42: 104-14.
- Federal Trade Commission, Department of Justice. (2004). Improving Health Care: A Dose of Competition. https://www.ftc.gov/sites/default/files/documents/reports/improving-health-care-dose-competitionreport-federal-trade-commission-and-departmentjustice/040723healthcarerpt.pdf.
- Sloan, F. A., G. A. Picone, D. H. Taylor and S. Y. Chou. (2001). Hospital Ownership and Cost and Quality of Care: Is There a Dime’s Worth of Difference? Journal of Health Economics, 20 (1): 1-21.
- Sloan F. (2000). Not-for-Profit Ownership and Hospital Behavior. Handbook of Health Economics, vol. 1, edited by A. J. Culyer and J. P. Newhouse

You must be logged in to post a comment.