Abstract
Prescription copayment coupons are distributed by pharmaceutical companies to reduce patients’ out-of-pocket copayments for specific drugs. When a commercially insured patient uses a coupon to fill a prescription, her copay is reduced and the manufacturer pays the balance of the copay. The patient’s insurer pays the remaining cost of the prescription. Copay coupons have come under scrutiny by some who argue they circumvent formularies and hinder generic substitution, thereby leading to higher drug spending. Others argue that coupons help patients access necessary drugs. To shed light on this issue, we examined copay coupon availability for the top 200 drugs (by spending) in 2014. Of these, 132 were brand drugs, and 90 of those had coupons available. No generic drugs had coupons. Among brands with copay coupons, 49 percent had a generic equivalent or close generic substitute available at lower cost. On the other hand, a majority (51%) were for drugs with no generic substitute—including 12 percent for drugs with no close therapeutic substitute of any kind. These results suggest that most copay coupons are not affecting generic substitution, and many may help patients afford therapies without good alternatives. As such, the copay coupon landscape seems more nuanced, and proposals to restrict coupons should ensure that patients who currently rely on them are not harmed.
Introduction
Copayment coupons offered by pharmaceutical manufacturers have become an important but controversial tool to address high out-of-pocket costs for prescription drugs. On one side, patient groups and manufacturers tout coupons’ role in increasing access to necessary therapies for patients who could not otherwise afford them. By using a coupon when filling a prescription, an insured patient reduces or eliminates the copayment required by their drug plan’s formulary. Thus, coupons reduce patients’ out-of-pocket costs, and provide access to needed therapies. Such access is particularly important given the high cost-sharing imposed on some drugs, and increasing deductibles.1 Proponents further argue that formularies designed to maximize profits frequently ignore therapeutic differences across drugs and patients, and are insensitive to doctors’ judgments of their individual patients’ welfare.
On the other side, insurers and pharmacy benefit managers (PBMs) argue that coupons circumvent benefit design, and their use ultimately results in higher premiums for everyone. PBMs design formularies to drive prescription volume towards certain products. In particular, medication use is very sensitive to tiering, and patients are more likely to use and adhere to medications with low copayments.2 This makes formulary placement an important lever in drug price negotiations; by threatening to place drugs on higher tiers unless manufacturers lower net prices, PBMs can extract higher rebates from brand drug manufacturers. Coupons circumvent tiering, and — opponents argue — raise drug expenditures, inject waste into the system, and increase drug prices.3,4 In 2013, Express Scripts excluded 48 drugs from its national formulary to push back against manufacturer coupon programs.5 Coupons have been particularly criticized for hindering generic substitution and thereby helping brand drug manufacturers to fend off generic competition.6
Federal and state policymakers tend to side with the payers in this debate. Coupons are banned from use on drugs purchased with federal healthcare insurance, including Medicare and Medicaid, because they violate federal anti-kickback statutes. Prior to 2012, Massachusetts banned all coupon use in the state; in 2012 the ban was repealed and limited to the use of coupons only on drugs with generic equivalents. The repeal included a sunset provision calling for the full ban to be reinstated in June 2017, but the reinstatement has been postponed. In 2017, California passed a state law banning the use of coupons to purchase drugs with generic equivalents, and New Jersey is currently considering similar legislation.7
However, much remains unsettled about how coupons affect patient behavior and drug costs. Legitimate questions have been raised recently about whether formulary tiering drives market share to the most cost-effective drugs, or if it may be used to drive share to products that offer the largest rebates or higher profits. For example, in some cases formularies place more expensive brand name drugs on more favorable tiers than less expensive generics — presumably because the PBM makes more money on these drugs.8
Using data collected from coupon aggregators, we describe the broad landscape of coupon availability. We find a story that is much more nuanced than has been commonly described.
Background
Copayment coupons have become increasingly common — in 2009 there were fewer than 100 brand name drugs with coupon programs, increasing to more than 700 by 2015;9 2 in 2016, one in five brand prescriptions in commercial insurance plans used a copay assistance coupon.10 Copay coupons can be distributed by physicians at the time a prescription is written, through magazines or newspaper advertising, or printed from the web. When a patient fills a prescription and uses a coupon, her copayment is reduced (or eliminated), and the pharmacy sends the coupon to the manufacturer for redemption. The patient’s insurer pays the balance of the cost of the prescription, as if the full copayment had been paid by the patient. In many cases, the insurer does not know that a coupon has been used. Some commercial payers have banned the use of copay coupons on a limited set of specialty drugs,11 but they are otherwise commonly used by patients with commercial drug coverage.
Relatively few studies of drug coupons have been published. A few articles describe how coupons may lead to higher total drug spending, but do not provide empirical evidence.12,13 Two empirical studies of coupons have looked at patient behavior, finding a) that coupons for branded statins are associated with higher utilization and lower rates of discontinuation and short-term switching,14 and b) that most coupons on specialty drugs reduce monthly cost sharing to under $250, a level at which patients are far less likely to abandon prescriptions.15 A third empirical study examined drug coupons available in March 2013 and found that the majority were for therapies for which less expensive alternatives existed, noting that coupons had the potential to increase drug costs.16
The most detailed empirical coupon study to date focuses exclusively on 85 brand name drugs that were facing generic entry between 2007 and 2010, 23 of which had copay coupons available. Coupons were associated with a 3.4 percentage point reduction in the rate of generic substitution, from 95 percent on average, to 92 percent. Coupons were also associated with faster branded price growth of 12-13 percent versus 7-8 percent per year, and the introduction of a copay coupon was estimated to increase retail spending by 1.2-4.6 percent over five years.17 Other authors have cited these results in calling for the FTC to encourage states to ban all copay coupons,18,19 although the original study was limited to coupons on drugs with generic equivalents. We know of no empirical analysis on the impact of coupons on drug costs when the drugs in question do not have generic substitutes.
Data
We used the 100 percent sample of de-identified Optum Clinformatics® Data Mart (OptumInsight, Eden Prairie, MN) pharmacy claims to identify the top 200 drugs by spending in 2014 that had been in the market since at least 2012. For each drug, we calculated total spending as the sum of standard costs across all 2014 claims for the given brand name. We used First Data Bank’s “product naming” indicator20 and Medicare Part D claims from 2013 to determine whether each of the 200 drugs was a generic drug, a single-source brand drug (SS), a multisource brand drug (MS), or a SS drug that was undergoing generic challenge (SS to MS).21
Following Dafny et al. (2017), we sourced copay coupon availability information from archived versions of the drug coupon consolidator site www.internetdrugcoupons.com to determine which drugs had coupons available in 2014. As a proxy for the prices of the drugs analyzed, we used the average cost per claim by brand name based on data reported by CMS.22 For single-source couponed drugs in our sample, we engaged two pharmacy professors from the USC School of Pharmacy to identify drugs that they considered close therapeutic substitutes (CTS) for the drugs on our list. We cleaned their suggestions to ensure that a) the suggested CTS were available in 2014, and b) if a suggested CTS had a generic equivalent, the generic form of the drug was also among the CTS group, if it was available in 2014. More detail on data sources and methods is available in the online Technical Appendix.21
Results
Figure 1 shows how the starting sample of 200 highest expenditure drugs in 2014 was allocated through subsequent analyses. (See Table 1A in the online Technical Appendix21 for a complete list of the 200 drugs considered.) Of the 200 drugs considered, 68 were generics, none of which had coupons; in fact, coupons appear to be exclusively used on branded drugs, at least among high expenditure drugs. Of the remaining 132 brand drugs, 90 had coupons and 42 did not.
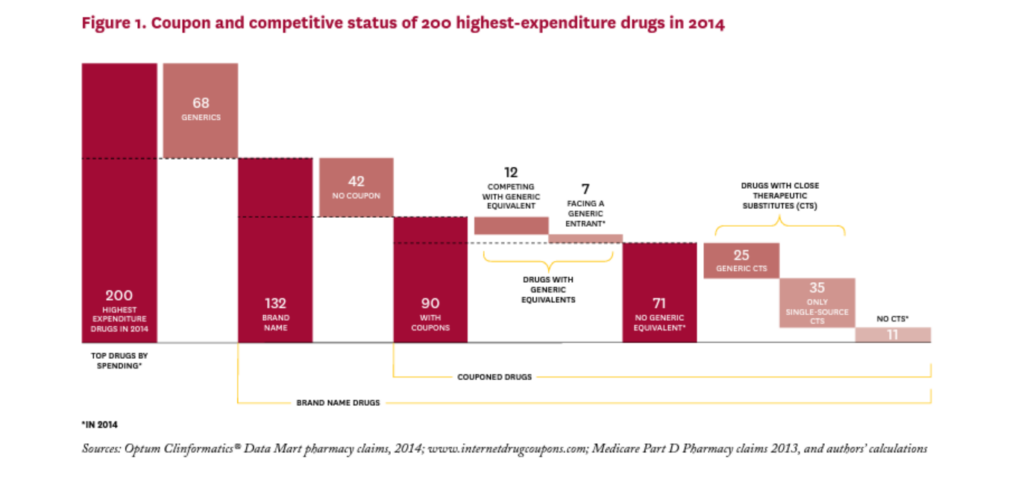
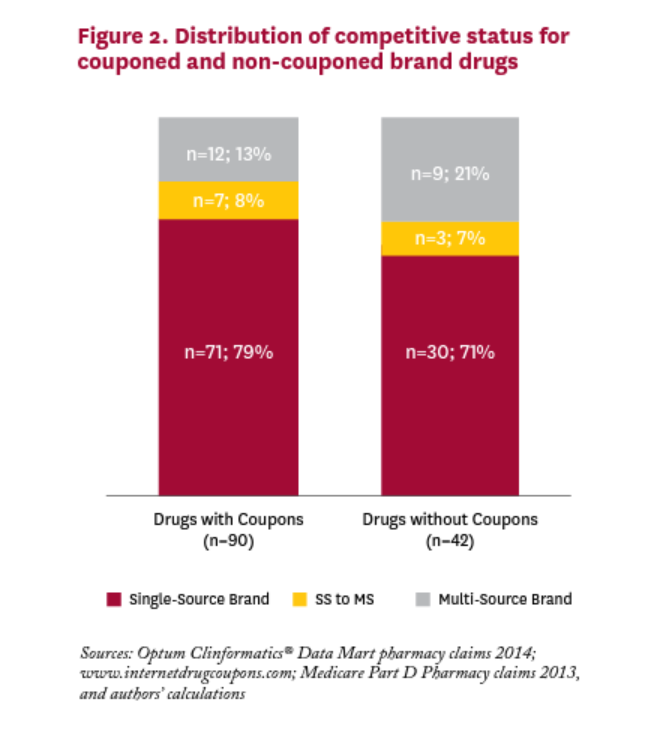
Of the 90 branded drugs with coupons, 12 (13%) were multi-source brands, that is, had generic equivalents that entered the market before 2014, and seven (8%) were brand drugs facing generic entry some time in 2014 (SS to MS). The remaining 71 drugs (79% of drugs with coupons) were single source brands without generic equivalents at any point in 2014.
Coupon Characteristics
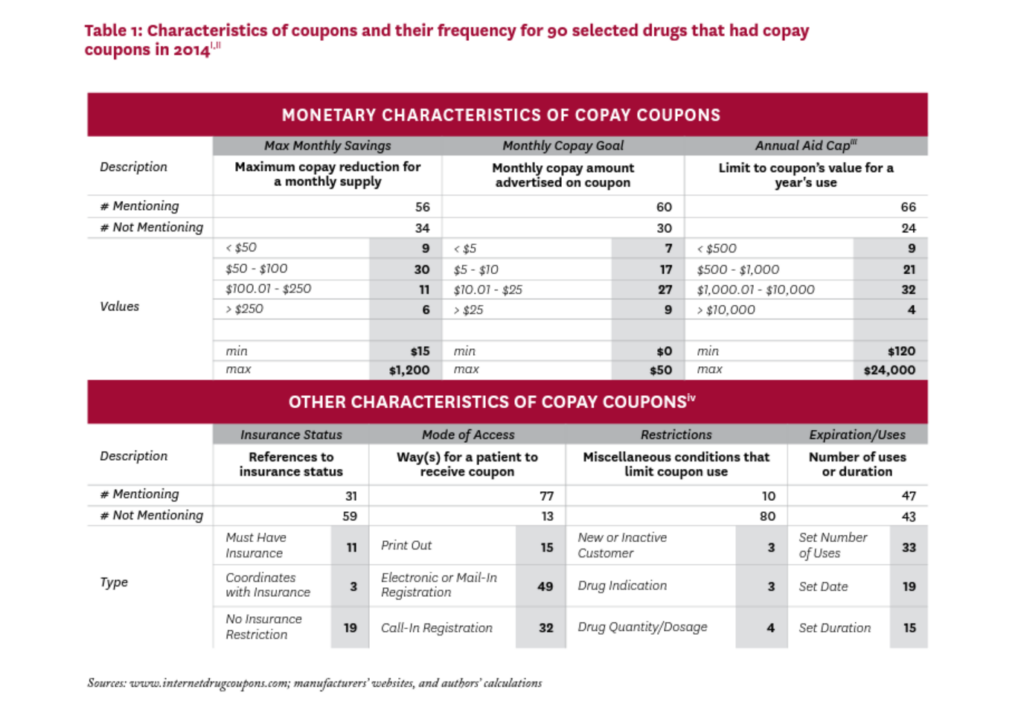
Table 1 summarizes selected characteristics of the coupons in our study. There was little standardization in their attributes, and characteristics that were explicitly addressed in many coupons were left completely unmentioned in others.
Most coupons were available via electronic or mail-in registration, or required a phone call to establish registration. A few coupons required that the patient be a first-time or not-recent user of the drug, or that the drug be prescribed for a specific indication, or were otherwise specific about the drug’s quantity or dosage. About half of the 90 coupons in our sample imposed a limit for the duration of the offer, the maximum number of uses, or a set expiration date.
Of the 56 coupons that mentioned a maximum monthly savings amount, most were in the $50-$100 range, although six offered maximum monthly savings greater than $250. Of the 60 coupons that specified a target copayment amount (that is, the patient copayment when the coupon is used), 51 sought to lower the monthly copayment to $25 or less. Sixty-six coupons mentioned an annual cap on the total amount of savings from the use of the coupon, ranging from less than $500 to $24,000; 36 coupons had an annual cap over $1,000.
Coupon Distribution
Figure 2 shows the distribution of brand drugs with and without coupons in 2014. We cannot reject the null hypothesis that the distribution is the same for brand drugs with and without coupons;v most drugs in both categories have no generic equivalent. For brand drugs with coupons in 2014, only one in five was facing or would be facing generic competition in that year.
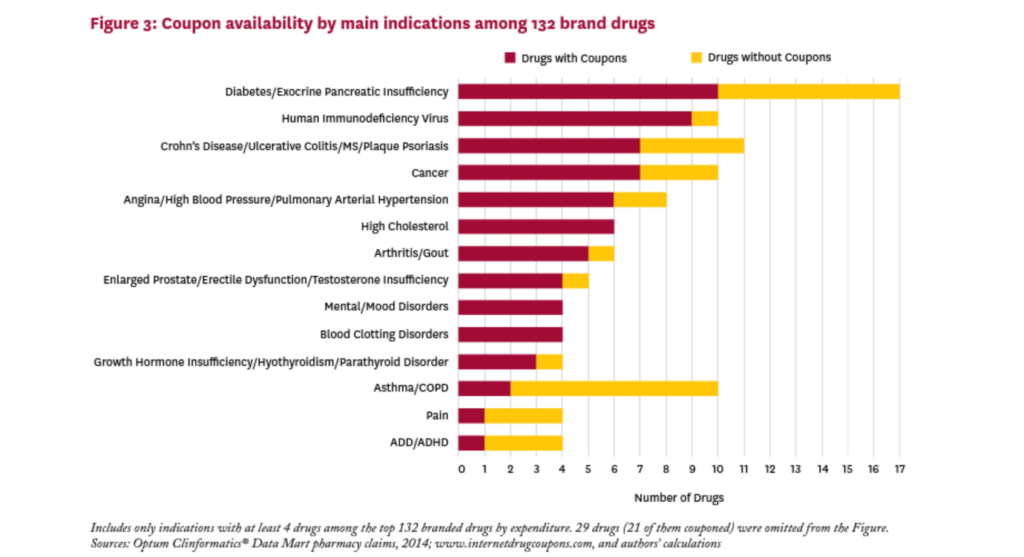
Figure 3 shows the main indications treated by the brand drugs in our sample, and the relative share of couponed drugs by indication. These drugs treat a wide variety of conditions, and all indications with at least four drugs in our sample had one or more drugs with a coupon. The proportion of brand drugs with a coupon varies greatly by indication, from 20 percent for drugs for asthma/COPD to 100 percent for drugs treating high cholesterol, mental/mood disorders, and blood clotting disorders. Of the 17 drugs in the sample that treat diabetes or exocrine pancreatic insufficiency, ten (59%) had a coupon in 2014.
Coupons’ Role in Drug Substitution
Many critics of coupons focus on the role they play in discouraging patients from switching to less expensive generic substitutes. Indeed, Dafny et al. (2017) have shown that 23 drugs with coupons facing generic entry in 2007-2010 had a small but significantly lower generic substitution rate (92% vs. 95%) than similar non-couponed drugs. And some recently passed state laws have banned the use of copay coupons when a generic equivalent is available. But in our sample of 90 brand drugs with coupons in 2014, only 19 (21%) had a generic equivalent competitor in the market that year. Fending off substitution to a less expensive generic equivalent is unlikely to be the rationale behind the other 71 coupons in 2014, which are all for single source drugs with no generic equivalent. The rationales for coupons on these drugs are likely more nuanced.
To better understand coupons’ role in this set of 71 single-source brand drugs, we identified a group of “close therapeutic substitutes” (CTS) for each drug, based on the judgment of two pharmacy professors at USC. These CTS are not equivalent to the index drug, but if the index drug is unavailable, our experts judged that a population of patients might use them as substitutes in most cases.
Table 2 summarizes these results (the complete list of SS drugs with coupons and their CTS can be found in the Technical Appendix21). Panel A characterizes the 71 SS couponed drugs according to the set of CTS each faces. Eleven of the 71 drugs (15%) were judged to have no close therapeutic substitutes. The coupons on these drugs are clearly enhancing patient access by lowering patient out-of-pocket costs, but they are not discouraging the use of less expensive alternatives, since no alternatives exist.
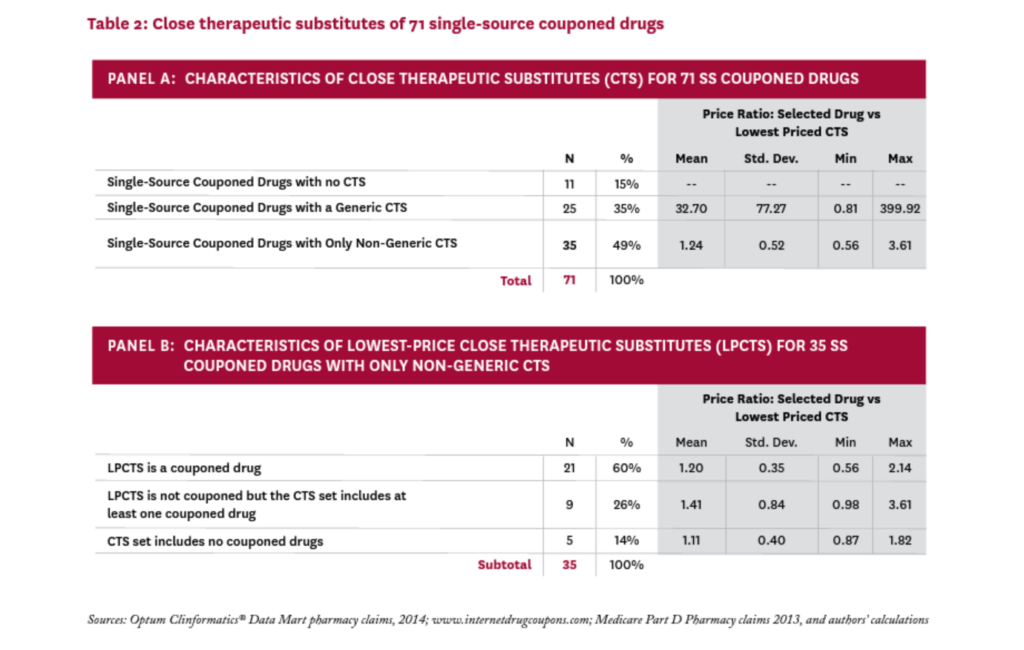
For the remaining 60 SS couponed drugs, the coupons are both enhancing access to the drug and discouraging the use of alternatives that may be less expensive. To explore the possible impact of these disincentives, we calculated a proxy “price” for all 71 SS couponed drugs, and all CTS, (using the average cost per claim from Medicare Part D claims, as described in the Technical Appendix21). For each SS couponed drug, we identified the lowest-price drug among its CTS, calling it the lowest-price close therapeutic substitute (LPCTS), and calculated the ratio of the index drug’s price to the price of its LPCTS.vi
Twenty-five of the 71 SS couponed drugs had a generic CTS; in these cases, the LPCTS was always a generic, and the price of the SS couponed drug was, on average, 33 times that of the (generic) LPCTS. Given such a large differential, it seems likely that coupons on these 25 drugs could increase overall drug costs significantly.
Thirty-five of the 71 SS couponed drugs had no generic CTS, and the price of the index drug was, on average, 1.24 times that of its lowest priced alternative. In 11 cases, the index drug was less expensive than its lowest priced alternative. While the coupons on these drugs might discourage patients from taking less expensive drugs, the average price difference was modest and thus unlikely to substantially raise total drug costs.
We examined these 35 drugs to better understand the role that coupons may play in their competitive market dynamics. Thirty of them (86%) were facing a close therapeutic substitute that was also couponed; in 21 of these cases, the drug’s lowest-price CTS was also couponed. In these instances, the manufacturer’s decision to coupon the index drug seems a strategic response to a competitor who is also issuing coupons.
Only five SS couponed drugs had neither a generic nor a couponed CTS in 2014: Zytiga, Tarceva, Levemir, Copaxone, and Tamiflu; their prices were, on average, 11 percent higher than that of their LPCTS. The first three still have no generic equivalent, while Copaxone had a generic version approved in 2015 and Tamiflu in 2016.
Discussion
Prior empirical work on copayment coupons has focused on their role in diminishing generic substitution rates. Dafny et al. (2017) have shown that, in a small sample of drugs facing generic challenge between 2007 and 2010, coupons did modestly reduce generic substitution rates, and some researchers, media, and policy advocates point to these results in calling for a ban on all copay coupons.
But we find that among the highest expenditure drugs with coupons in 2014, only 21 percent had a generic equivalent on the market at any point during that year — the vast majority (79%) of coupons were for drugs without generic equivalents. The general manufacturer practice of issuing coupons is clearly being driven by additional considerations, and a ban on all coupons may be overbroad.
Our results can be compared with those of Ross and Kesselheim (2013), who find that only 8 percent of the couponed drugs they examined had a generic substitute, but identified an additional 54 percent of the couponed drugs in their sample as having a lower-cost generic alternative within the same drug class (a different measure than our identification of close therapeutic substitutes).16 In our analysis using the full sample of 90 drugs with coupons, 21 percent had a generic equivalent, and 28 percent had a generic drug among its close therapeutic substitutes. The remaining 51 percent of couponed drugs in our sample had either no substitute at all (12%), or had only single-source branded CTS (39%).
Coupons and Drug Costs
While we cannot determine whether coupons raise drug costs directly, our classification suggests which coupons may be more or less likely to raise costs, and if they raise costs, whether they are providing a clear benefit in exchange. The 21 percent of coupons on drugs with generic equivalents seem very likely to raise costs without any obvious benefit. At the other end of the spectrum, the 12 percent of coupons on drugs with no therapeutic substitute of any kind may or may not raise costs, but improve access for more price-sensitive patients to drugs with unique benefit.
Falling in between are the coupons on drugs with imperfect therapeutic substitutes, which represent two-thirds of our sample. Patients use these coupons to reduce copays on singlesource drugs that their doctors have prescribed, but their PBM disfavors. For some of these patients, using a different drug may make little or no difference in clinical benefit. In other cases, substitution may not be suitable due to specific comorbidities, drug interactions, or other individual circumstances. In these cases, coupons help patients afford the therapy chosen by their doctor rather than the one preferred by their PBM. While coupons may raise insurer costs, in these cases they may provide important value to beneficiaries.
Thus, the 39 percent of coupons on drugs with only sole source CTS may provide important benefits with minimal impact on total drug costs because the substitution they induce is towards a similarly priced product. The 28 percent of coupons in our sample that are for drugs with generic CTS may also provide important benefits, but have the potential to raise drug costs significantly. Calls for a broad ban on coupons ignore these important distinctions.
The Role of PBMs
While often argued that drug coupons undermine the tiered-formulary system that PBMs use to limit prescription drug spending, they could also be viewed as a byproduct of PBM consolidation and influence in the market. While coupons may raise drug costs in some cases, they are a strategic response by pharmaceutical manufacturers to PBMs’ control over formulary placement. The widespread use of coupons by nearly all brand manufacturers is evidence of this dynamic, which is exacerbated by consolidation in the PBM industry. The three largest PBMs (Express Scripts, CVS Caremark and OptumRx) control 80 to 85 percent of the U.S. market;23 as such, a drug’s placement on these PBMs’ national formularies has a large effect on its market share. Despite similar efficacy on average, a preferred statin on one formulary may be non-preferred on another, and vice-versa, inducing manufacturers who find themselves on higher copay tiers to provide direct discounts to patients to remain competitive in the marketplace.
Alongside this dynamic, the incentives PBMs are creating for patients to use certain drugs and not others are becoming stronger and more forceful. A recent poll finds that 44 percent of beneficiaries in employer-sponsored plans face drug formularies with four or more tiers, with average copays ranging from $11 for tier 1 drugs to $110 for drugs on tier 4. And beneficiaries are bearing a larger out of pocket burden for drugs — average deductibles in single coverage plans have increased from $584 in 2006 to $1,505 in 2017, while the percentage of workers with prescription drug deductibles separate from their medical deductibles has increased from 10 percent in 2005 to 15 percent in 2017. Finally, the share of employees enrolled in high-deductible health plans has increased from 4 percent in 2006 to 28 percent in 2017.1
PBM consolidation can lower drug costs by increasing their bargaining power with manufacturers, but the reduced competition resulting from consolidation creates offsetting incentives for higher prices, and further shifts the balance of power from manufacturers to PBMs. Manufacturer coupons weaken formulary compliance by reducing patient out-ofpocket costs for non-preferred drugs. However, their impact on overall drug spending is uncertain, and depends on which drugs are couponed (multisource or single-source brands) and the size of the discount relative to the rebate received by the plan sponsor. For example, take two drugs each with a list price of $500. The net cost to the health plan and patient is the same if the drug carries a 20 percent rebate and $25 copay compared to a 25 percent coinsurance rate and $100 coupon ($375 to plan; $25 to patient). The only difference is that the savings generated by a rebate may be shared by all plan members (via lower premiums, if PBMs pass 100 percent of the rebate through to insurers and insurers in turn use those savings to lower premiums), whereas a coupon bestows the savings directly on the patient using the drug. If the PBM does not pass through 100 percent of the rebate to plan sponsors, then PBM profits are higher under the no-coupon scenario.
Limitations
Our analysis describing the copay coupon landscape has several limitations. First, it is based on coupon availability, but we lack data on coupon redemption so do not know the intensity of their use. Also, our coupon data come from a single consolidator website, and may not contain all coupons available in 2014. The claims data we have used to identify the top 200 drugs are from one large insurer, and may not be nationally representative. Finally, as with all drug pricing analysis, we do not have actual net prices; while we have used average Medicare cost per script when comparing “prices” of close therapeutic substitutes, we do not observe rebates, which may be an important reason one drug is favored over another on a formulary, and an important element in assessing a drug’s final net cost. Further work (and different data) will be needed to better understand coupons’ impact on patient behavior such as drug switching, substitution, adherence, abandonment, and, ultimately, healthcare expenditures.
Conclusion
Manufacturers may offer copay coupons to achieve various goals: influence patients’ tradeoffs between using their drug or a competing therapy; respond to other manufacturers’ competitive tactics; or provide access to patients whose formularies place their therapies on high copay tiers. Our findings suggest that all these roles are plausible and potentially important in different circumstances. Some may have the effect of raising drug expenditures with no impact on patients’ health, while others may provide patients with the means to afford life-changing medications that they could otherwise not access. Any policy intervention to restrict coupons’ availability or their utilization should be carefully tailored. Our findings suggest a blanket ban could harm patients both financially, through higher out-of-pocket costs, and clinically, through therapeutically inferior switching. Policymakers should take these effects into account.
Footnotes
i Characterization is based on information readily mentioned on the manufacturer’s coupon.
ii Crestor and Premarin had two coupons that featured different characteristics. In this analysis, the Crestor coupon from February 10, 2014 and the Premarin coupon from June 10, 2014 were used.
iii Limit is explicitly indicated on coupon or calculated by multiplying monthly savings by allowed number of uses within a year.
iv Categories may overlap (for example an offer that can be registered by phone or by mail).
v Wilcoxon-Mann-Whitney test P= 0.32. H0 : distribution(couponed) = distribution(not couponed).
vi Note that the proxy prices used in this analysis do not include undisclosed manufacturer rebates paid to the PBM. Relative prices calculated in this way may therefore differ from relative prices based on fully discounted prices.
References
- Kaiser Family Foundation 2017 Employer Health Benefits 2017 Annual Survey. Retrieved on 1/18/2018 from: https://www.kff. org/health-costs/report/2017-employer-health-benefits-survey/
- Goldman, D. P., Joyce, G. F., & Zheng, Y. (2007). Prescription drug cost sharing: associations with medication and medical utilization and spending and health. JAMA, 298(1), 61-69.
- Express Scripts. 2016. The Dark Side of Copay Coupons. Retrieved on 1/11/2018 from: http://lab.express-scripts.com/lab/ insights/industry-updates/the-dark-side-of-copay-coupons
- Ornstein, Charles. 2016. Are Copay Coupons Actually Making Drugs More Expensive? Propublica. Retrieved on 1/11/2018 from: https://www.propublica.org/article/ are-copay-coupons-actually-making-drugs-more-expensive
- Wehrwein, Peter. 2015. A Conversation with Steve Miller, MD: Come in and Talk with Us, Pharma. Retrieved on 1/11/2018 from: https://www.managedcaremag.com/archives/2015/4/ conversation-steve-miller-md-come-and-talk-us-pharma
- Schultz, David. (Oct. 1 2012) Drug companies fend off competition from generics by offering discount coupons. The Washington Post. Retrieved on 1/11/18 from: https://www.washingtonpost. com/national/health-science/drug-companies-fend-off-competition-from-generics-by-offering-discount-coupons/2012/10/01/ c7a393be-f05f-11e1-ba17-c7bb037a1d5b_story. html?utm_term=.211a80700a57
- Sagonowsky, Eric. (Feb. 6 2017) Pharma’s copay coupons, a key marketing tool, face new limits in California. www.FiercePharma. com. Retrieved on 1/1/18 from: https://www.fiercepharma.com/ pharma/california-legislator-takes-aim-at-industry-s-copaycoupons-pricing-fight
- Ornstein, Charles and Katie Thomas. (Aug. 6 2017) Take the Generic, Patients Are Told. Until They Are Not. The New York Times. Retrieved on 1/11/2018 from: https://www.nytimes. com/2017/08/06/health/prescription-drugs-brand-name-generic. html?r=0
- Johnson, Carolyn Y. (May 12 2016) Secret rebates, coupons and exclusions: how the battle over high drug prices is really being fought. The Washington Post. Retrieved on 1/1/18 from: https://www.washingtonpost.com/news/wonk/wp/2016/05/12/ the-drug-price-arms-race-that-leaves-patients-caught-in-themiddle/?utm_term=.826b55a86e56
- IQVIA Institute for Human Data Science. (2017) Medicines Use and Spending in the US: A Review of 2016 and Outlook to 2021. Retrieved 2/2/2018 from: https://www.iqvia.com/institute/ reports/medicines-use-and-spending-in-the-us-a-review-of-2016
- Sandhu, Alaina and Steve Avey. (2014) Copay Coupons for Specialty Drugs: Strategies for Health Plans and PBMs. AIS’s Management Insight Series. Retrieved 1/11/18 from: https:// aishealth.com/sites/all/files/file_downloads/gc4p04_08-14.pdf Disclosures 12 Grande, D. (2012). The cost of drug coupons. JAMA, 307(22), 2375-6.
- Ubel, P. A., & Bach, P. B. (2016). Copay assistance for expensive drugs: A helping hand that raises costs. Annals of Internal Medicine, 165(12), 878-879.
- Daubresse, M., Andersen, M., Riggs, K. R., & Alexander, G. C. (2017). Effect of prescription drug coupons on statin utilization and expenditures: A retrospective cohort study. Pharmacotherapy: The Journal of Human Pharmacology and Drug Therapy, 37(1), 12-24.
- Starner CI, Alexander GC, Bowen K, Qiu Y, Wickersham PJ, Gleason PP. Specialty drug coupons lower out-of-pocket costs and may improve adherence at the risk of increasing premiums. Health Affairs (Millwood). 2014;33(10):1761-1769.
- Ross, J. S., & Kesselheim, A. S. (2013). Prescription-drug coupons-no such thing as a free lunch. The New England Journal of Medicine, 369(13), 1188.
- Dafny, L., Ody, C., & Schmitt, M. (2017). When discounts raise costs: The effect of copay coupons on generic utilization. American Economic Journal: Economic Policy, 9(2), 91-123.
- Hutchins Center Policy Brief (May 2017). Ten challenges in the prescription drug market-and ten solutions. Washington: Brookings Institution Press. Retrieved on 1/18/2018 from: http://libproxy.usc.edu/login?url=https://search.proquest.com/doc view/1895568520?accountid=14749
- Morton, F. S., & Boller, L. (2017). Enabling competition in pharmaceutical markets. Washington: Brookings Institution Press. Retrieved on 1/18/2018 from: https://www.brookings.edu/ wp-content/uploads/2017/05/wp30_scottmorton_competitioninpharma1.pdf
- First Databank MedKnowledge Documentation. September 2012.
- Online technical appendix available at: http://healthpolicy.usc. edu/Prescription_Drug_Copayment_Coupon_Landscape.aspx
- Centers for Medicare and Medicaid Services (CMS) 2015 Medicare Drug Spending Data. Part D Data. Retrieved 1/11/2018 from: https://www.cms.gov/Research-StatisticsData-and-Systems/Statistics-Trends-and-Reports/ Information-on-Prescription-Drugs/2015MedicareData.html
- Sood, N., Shih, T., Van Nuys, K. and Goldman, D. (June 2017) The Flow of Money Through the Pharmaceutical Distribution System. USC Schaeffer Center for Health Policy & Economics Policy Report. Retrieved on 1/11/2018 from: http://healthpolicy. usc.edu/Flow_of_Money_Through_the_Pharmaceutical Distribution_System.aspx
You must be logged in to post a comment.