Policymakers frequently point toward increasing consolidation of healthcare markets as a driver of high costs in the U.S., and the hospital industry is no exception. Although empirical studies generally find hospital systems are associated with higher prices, in theory hospital systems might be able to lower costs by leveraging efficiencies unavailable to independent hospitals. We analyzed state-level hospital system participation in 2010 and 2014 and its relationship with state-level per capita hospital spending. We found that most hospital systems span across markets (defined here by core-based statistical areas or CBSAs), and states with higher system participation were more likely to have below median per capita hospital spending. Our work suggests that researchers and policymakers should consider hospital system membership separately from market concentration. Moreover, future research should work to understand key organizational differences between system and independent hospitals that may contribute to cost savings.
Introduction
The American Hospital Association (AHA) defines hospital systems as two or more hospitals owned, leased, sponsored, or contract-managed by a central organization. Relative to independent hospitals, hospitals that belong to systems may have better access to capital and greater financial stability, increased efficiency, and improved planning capabilities and ability to retain top talent.[1] These factors may lead to lower costs for system hospitals relative to independent ones. However, there is empirical evidence that system hospitals are associated with higher prices due to increased bargaining power.[2] Furthermore, system membership is often studied indirectly through hospital mergers and acquisitions (events by which independent hospitals become system hospitals), and these studies also generally find that mergers and acquisitions are associated with higher prices.[3,4]
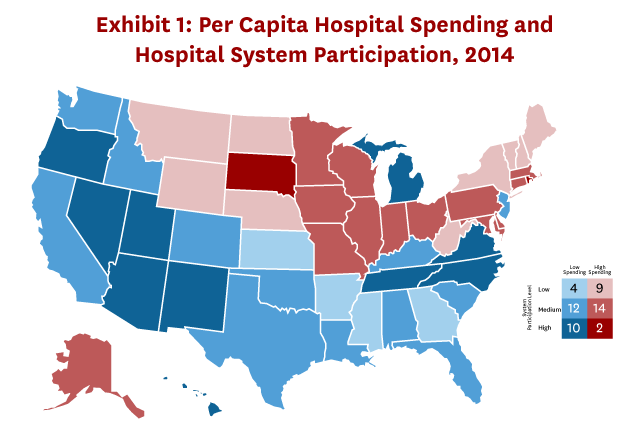
Using state-level data from the National Health Expenditure Accounts (NHEA) in 2014 and hospital characteristics from the AHA, we found states with hospital system participation levels in the top 25th percentile were more likely to have below median per capita hospital spending (Exhibit 1). Similarly, states in the bottom 25th percentile of system participation were more likely to have above median spending.
Study Data and Methods
We used state-level per capita hospital spending data from the NHEA and hospital characteristics from the AHA Annual Survey Database for 2010 and 2014, which is the most recent year of state-level data available from the NHEA.[5,6] We included all nonfederal short-term general acute care hospitals in our sample.
Our outcome variable is state per capita hospital spending. All values have been inflated to 2017 dollars. Our key independent variable is state-level hospital system participation. We measured hospital system participation as the share of total beds within a state that belong to system hospitals.
First, we conducted a descriptive analysis to understand the geography and reach of hospital systems. We classified each system into four categories that correspond to broader degrees of geographic reach—core-based statistical area (CBSA) system, state system, regional system, and national system. All hospital members in a CBSA system are located in the same CBSA. In a state system, hospital members span CBSAs but are located within a single state. Regional systems have member hospitals that span multiple states but are located within one of four U.S. Census regions. Finally, a national system is one in which member hospitals span across Census regions.
We then explored the relationship between state-level per capita hospital spending and hospital system participation. For our descriptive analysis, we classified states by spending (above or below median) and system participation (low, medium, or high, which correspond to the bottom 25th percentile, middle 25th-75th percentiles, and highest 25th percentile of system participation, respectively). We also estimated a regression of wage adjusted per capita hospital spending on a set of system participation quartile indicators, case mix index (a measure of patient severity) and the Saidin index (a measure of technological complexity). Details of the Saidin index construction are provided in the Appendix.
Our main results used unweighted regressions, and we estimated weighted regressions as a sensitivity analysis. We used three different measures for weights: total state population, total state inpatient admissions, and total hospital spending. Additionally, we estimated the models with and without adjusting spending for the wage index. Sensitivity analyses are presented in the Appendix.
Our study has several limitations. First, we do not determine the mechanisms that might be driving lower spending for system hospitals. Previous research has found system hospitals tend to have higher prices compared with non-system hospitals, so it is possible our findings reflect system hospitals providing greater utilization or quality of care. Second, we do not consider the potential interaction between hospital system membership and market concentration and whether one is more important for determining hospital spending.
Study Results
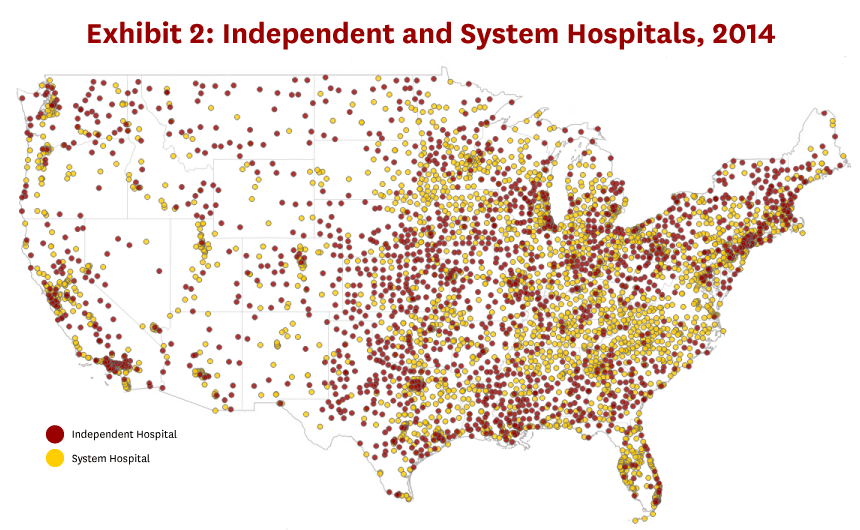
Between 2010 and 2014, system participation increased from 56 percent to 60 percent of hospitals, accounting for 65 percent and 73 percent of beds, respectively. Despite higher system participation, the relative size of systems has not changed, with an average of seven hospitals per system. Hospitals that belong to systems seem to be more concentrated in urban areas, but they are also well represented in rural areas (Exhibit 2).
Although we might expect hospital systems to be strongly correlated with hospital market consolidation, the majority of hospital systems spanned across CBSAs. Specifically, only 15 percent of system hospitals belong to a system that is contained entirely within a single CBSA, such as Los Angeles-Long Beach-Anaheim, California. The majority of hospital systems have a broader geographic reach: 23 percent of system hospitals belong to a state system, 20 percent belong to a regional system, and 42 percent belong to a national system, which is defined as spanning across at least two Census regions.
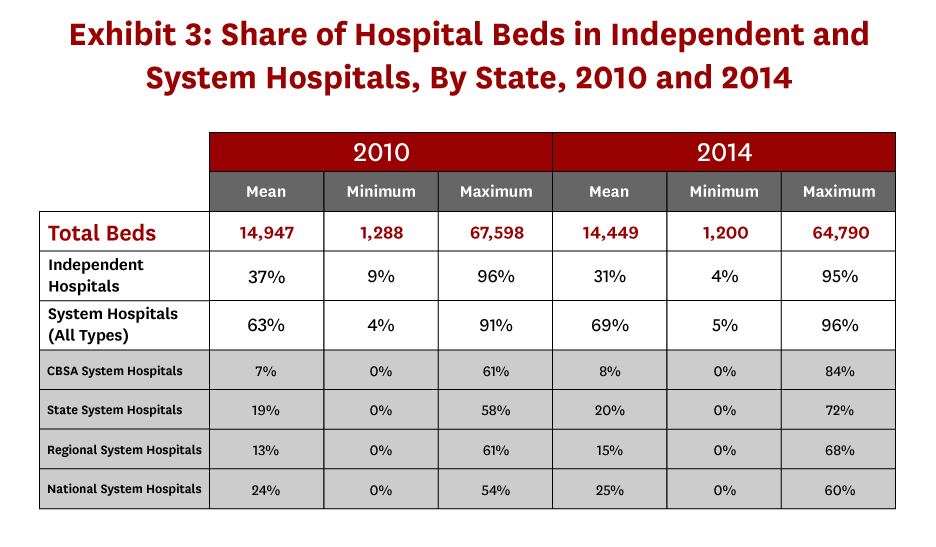
While the average state has a higher share of system hospitals than independent hospitals, and more cross-market system hospitals than CBSA system hospitals, we observe high variability in hospital types across states (Exhibit 3). Only one state (Rhode Island) has a share of CBSA system hospitals (measured by share of beds) greater than 30 percent in either year; the mean share is 7 percent in 2010 and 8 percent in 2014, and eighteen states have no CBSA system hospitals in 2014.
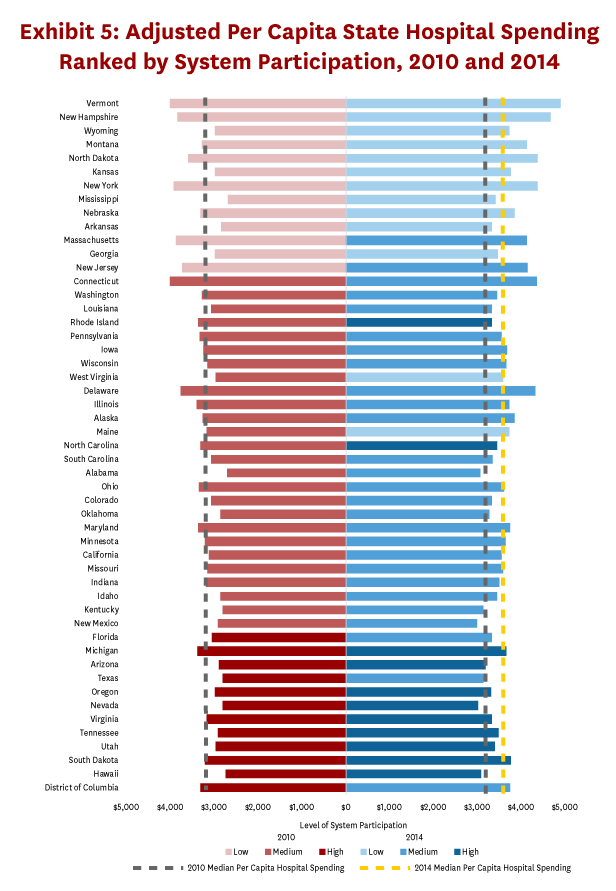
There may be concern that differences in patient complexity, labor costs, or hospital technology across states are driving the relationship between system participation and spending (Exhibit 1). Even adjusting for these factors, per capita hospital spending is generally lower (higher) in states with higher (lower) levels of system participation (Exhibit 4). Several patterns emerge when we compare adjusted per capita hospital spending in 2010 and 2014 (Exhibit 5). First, the majority of states are in the same system participation quartile in 2010 and 2014. Exceptions include Massachusetts and New Jersey, which shifted from the bottom 25th percentile of hospital system participation in 2010 to the 25th-75th percentiles in 2014. Conversely, Florida, Texas, and the District of Columbia shifted from the highest 25th percentile of hospital system participation in 2010 to the 25th-75th percentiles in 2014. Rhode Island, North Carolina, and New Mexico (West Virginia and Maine) moved from the 25th-75th percentiles of system participation in 2010 into the highest (lowest) 25th percentile in 2014. Moreover, although spending increased between 2010 and 2014, the cross-sectional relationship between hospital system participation and per capita hospital spending is consistent across 2010 and 2014.
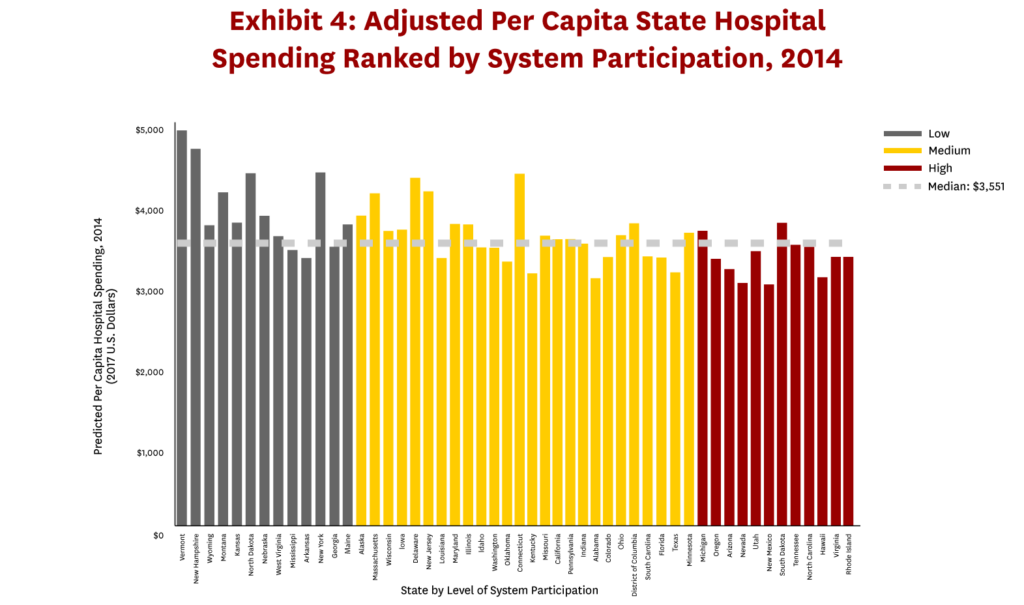
Average per capita hospital spending is 11 percent lower for states in the top quartile of system participation ($3,013) in 2010 compared with states in the lowest quartile ($3,380), and the differential increases to 19 percent in 2014 ($3,083 vs $3,821). Unadjusted and adjusted spending estimates for each system participation quartile are presented in the Appendix. Although we found a consistent relationship between hospital system participation and spending across 2010 and 2014, changes in system participation are only weakly correlated with changes in spending over this period (see Appendix). This result is not surprising since within state system participation as well as relative hospital spending across states has been relatively stable during our study period.
Discussion
We present a geographic description of hospital system membership and characterize the relationship between hospital system participation and state per capita hospital spending. Although system hospitals appear to be more concentrated in urban areas, we find a majority of system hospitals belong to cross-market systems. Moreover, states with higher degrees of system participation tend to have below median per capita hospital spending in both 2010 and 2014.
Policymakers often point to market concentration as a driver of rising healthcare prices, and hospital markets are no exception.[4,7,8] Market concentration and hospital system membership will be highly correlated to the extent that hospital system members are located within the same market. In contrast, a recent study found that 40-80 percent of hospital acquisitions occurred across hospital markets depending on the market definition.[9] Consistent with these findings, our study shows that the majority of system hospitals are part of systems that span across markets. These findings highlight the importance of treating hospital system membership and market concentration as two distinct issues in hospital research.
Recent work has shown that hospital prices have grown more than twice as much compared with physician prices for hospital-based care.[10] This finding points to the need for more nuanced policies that target specific settings within hospitals to control prices. Similarly, our main findings indicate policies that aim to control hospital prices or spending should consider more targeted recommendations around system membership. To inform these policies, future research should focus more on organizational differences between system hospitals and independent hospitals or their interaction with market concentration to better understand hospital spending variation.
Download the white paper here.
Read the technical appendix here.
References
- Ermann, D., & Gabel, J. (1984). Multihospital Systems: Issues and Empirical Findings. Health Affairs, 3(1), 50-64. doi:10.1377/hlthaff.3.1.50.
- Melnick, G., & Keeler, E. (2007). The effects of multi-hospital systems on hospital prices. Journal of Health Economics, 26(2), 400-413. doi:10.1016/j.jhealeco.2006.10.002.
- Lewis, M. S., & Pflum, K. E. (2017). Hospital systems and bargaining power: Evidence from out-of-market acquisitions. The RAND Journal of Economics, 48(3), 579-610. doi:10.1111/1756-2171.12186.
- M. G., & R. T. (2012). The impact of hospital consolidation – Update (Research Synthesis Report, No. 9). Robert Wood Johnson Foundation. doi:https://www.rwjf.org/en/library/research/2012/06/the-impact-of-hospital-consolidation.html.
- CMS Office of the Actuary. (2017, November 21). Health expenditures by state of residence: Summary tables, 1991-2014. Retrieved September 3, 2018, from https://www.cms.gov/Research-Statistics-Data-and-Systems/Statistics-Trends-and-Reports/NationalHealthExpendData/NationalHealthAccountsStateHealthAccountsResidence.html.
- American Hospital Association. (2010, 2014). AHA Annual Survey Database. Retrieved September 10, 2018, from http://www.ahadata.com/aha-annual-survey-database-asdb/.
- Examining the Impact of Health Care Consolidation, 115th Cong. (2018) (testimony of Martin Gaynor before the Committee on Energy and Commerce Oversight and Investigations Subcommittee).
- Dafny, L. (2009). Estimation and Identification of Merger Effects: An Application to Hospital Mergers. The Journal of Law and Economics, 52(3), 523-50. doi:10.3386/w11673
- Schmitt, M. (2017). Do Hospital Mergers Reduce Costs? Journal of Health Economics, 52(March), 74-94. doi:10.2139/ssrn.2599000.
- Cooper, Z., Craig, S., Gaynor, M., Harish, N. J., Krumholz, H. M., & Reenen, J. V. (2019). Hospital Prices Grew Substantially Faster Than Physician Prices For Hospital-Based Care In 2007–14. Health Affairs, 38(2), 184-189. doi:10.1377/hlthaff.2018.05424.

You must be logged in to post a comment.