By: Laura Liu (Indiana University), Hyungsik Roger Moon (USC), and Frank Schorfheide (University of Pennsylvania CEPR, NBER, and PIER)
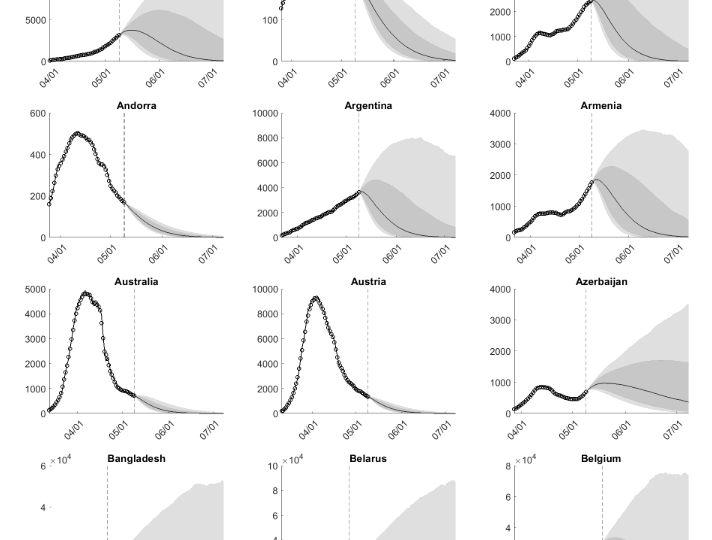
Our project contributes to the rapidly growing research on generating forecasts related to the current COVID-19 pandemic. We are adapting forecasting techniques for panel data to predict the smoothed daily number of active COVID-19 infections for a cross-section of approximately one hundred countries/regions. The data are obtained from the Center for Systems Science and Engineering (CSSE) at Johns Hopkins University.
Forecasting Examples
We choose three countries – China, South Korea, and Germany – as an example of the forecasting. These three countries have passed different stages of the pandemic. In Figure 1 we overlay two weeks of actual infections onto density forecasts generated from the weeks of 2020-04-04 (top panels) and 2020-04-18 (bottom panels).
Figure 1: Interval Forecasts and Actuals
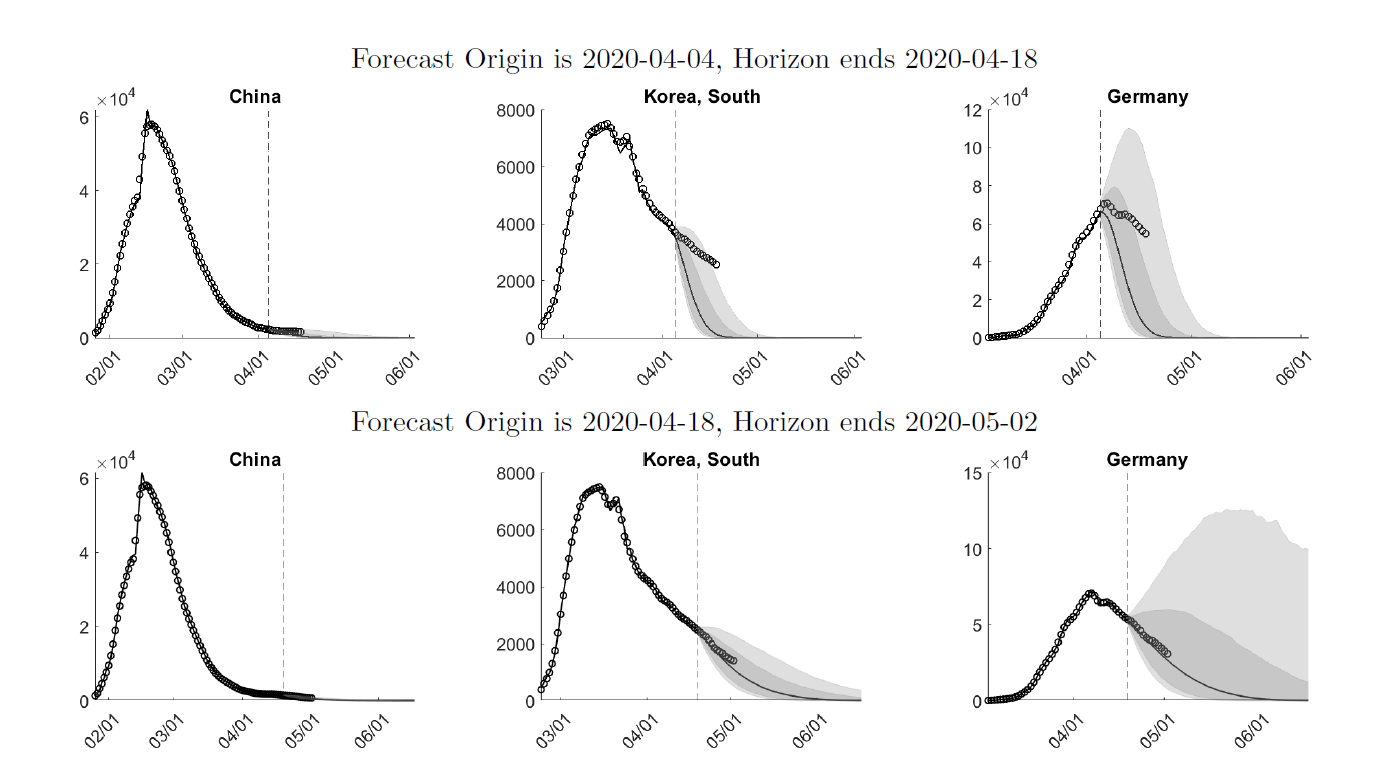
On 2020-04-04, the model forecasts a fairly quick recovery from the pandemic for all three countries. Comparing the predictive density to the actual caseloads indicates that while the real data are still within the predicted 10-90% bands, the model overestimates the speed of recovery.
Two weeks later, on 2020-04-18, the estimates have caught on to the slower decline, which translates into a more drawn-out recovery. While for South Korea the width of the bands associated with the short-run forecasts is smaller for the 2020-04-18 sample, the width for Germany increases.
The 2020-04-18 predictions are remarkably accurate: between 2020-04-18 and 2020-05-02 the median forecasts are very close to the actuals for all three countries. Our weekly expanded forecasts for more than 100 countries are available at https://laurayuliu.com/covid19-panel-forecast/.
Methodology
The panel data model developed in this paper to generate forecasts of COVID-19 infections is a reduced-form model. It processes cross-sectional and time-series information about past infection levels and maps them into predictions of future infections. While the model specification is motivated by the time-path of infections generated by the workhorse compartmental model in the epidemiology literature, the so-called susceptible-infected-recovered (SIR) model, it is not designed to answer quantitative policy questions, e.g., about the impact of social-distancing measures on the path of future infection rates.
In our forecasting model, the growth rates of the infections are decomposed into a deterministic component which approximates the path predicted by a deterministic SIR model and a stochastic component that could be interpreted as either time-variation in the coefficients of an epidemiological model or deviations from such a model. The deterministic component and the stochastic component are modeled with a piecewise linear trend and an autoregressive function, respectively.
The coefficients of this deterministic trend function are allowed to be heterogeneous across locations (countries in our project). The goal is not curve fitting – our model is distinctly less flexible in samples than some other models – but rather out-of-sample forecasts, which is why we prefer to project growth rates based on autoregressive fluctuations around a linear time trend.
A key feature of the COVID-19 pandemic is that the outbreaks did not take place simultaneously in all countries/regions. Thus, we can potentially learn from the speed of the spread of the disease and subsequent containment in country A, to make forecasts of what is likely to happen in country B, while simultaneously allowing for some heterogeneity across locations. In a panel data setting, one captures cross-sectional heterogeneity in the data with country-specific parameters. The more precisely these heterogeneous coefficients are estimated, the more accurate are the forecasts. A natural way of disciplining the model is to assume that the heterogeneous coefficients are “drawn” from a common probability distribution. If this distribution has a large variance, then there is a lot of country-level heterogeneity in the evolution of COVID-19 infections. If instead, the distribution has a small variance, then the path of infections will be very similar across samples, and we can learn a lot from, say, China, that is relevant for predicting the path of the disease in South Korea or Germany.
We report interval and density forecasts of future infections that reflect two types of uncertainty: uncertainty about model parameters and uncertainty about future shocks.
According to our model, there is a lot of uncertainty about the evolution of infection rates, due to parameter uncertainty and the realization of future shocks. Moreover, due to the inherent nonlinearities, predictive densities for the level of infections are highly skewed and exhibit substantial upside risk. Consequently, it is important to report density or interval forecasts, rather than point forecasts. We find that over a one-week horizon the empirical coverage frequency of our interval forecasts is close to the nominal credible level. Longer horizon predictions and predictions generated at the onset of the pandemic are more problematic because it is difficult to forecast the turning point of the infections.
Detailed explanations on the forecasting methodology can be found in our paper that is available from https://laurayuliu.com/covid19-panel-forecast/.
Extensions
There are a few extensions we plan to work on. First, while we are currently focusing on country-level aggregates, our model could be easily modified to accommodate, say, state- or county-level data. Secondly, we extend our model to allow for additional, data-determined breaks in the deterministic trend function as the pandemic unfolds and countries/regions are adopting new policies that accelerate or decelerate the spread of the virus and as more and more people become resistant to the infection. Thirdly, it is also worthwhile to link the heterogeneous coefficient estimates (or trans- formations thereof) to country-specific variables that measure social norms and policies to fight the pandemic. This could be done in a second step through ex-post regressions with the heterogeneous coefficient estimates as left-hand-side variables or, more elegantly, in a correlated random effects framework.
You must be logged in to post a comment.