The COVID-19 pandemic and the associated emergency interventions aimed at slowing its spread have impacted many aspects of life in the United States. It remains an ongoing public health crisis as cases and fatalities continue to rise throughout the country. Starting in mid-March, stay-at-home orders began to roll out across many states, dramatically reducing opportunities for a variety of in-person social interactions. The associated economic recession has threatened individuals’ financial and employment security, and large-scale shifts to remote schooling and working have posed challenges to everyday life. Together, these disruptions are likely to have a significant emotional toll on individuals. The public has been eager to understand not only the extent of the toll but also its trajectory as the pandemic unfolded.
Using data from the Understanding America Study (UAS), a population-representative online panel of households in the U.S., we sought to understand the impact of the pandemic on individuals’ day-to-day lives. The UAS has employed innovative techniques to collect participants’ experiences as they occur in real-time as individuals go about their days. These techniques involve asking participants about what they were experiencing in the moment and yield high-resolution snapshots of participants’ daily lives — information that is usually not available from standard surveys.
In this blog post we discuss how lives have changed since the pandemic started in mid-March. We were interested in the changes in participants’ location, social interactions, experience of stressors, financial worries, and emotional states. As part of a larger, ongoing survey, participants installed an app on their phone and were randomly prompted up to 6 times throughout the day for a week and answered questions about their immediate experiences. Data were collected on 162 middle-aged and older adults (ages 50-86) located throughout the contiguous 48 states in early March, late March, and early May. One sample was assessed in early March, another was assessed in late March, and both were followed up in early May. The two groups did not differ significantly in their sociodemographic characteristics. When our data were collected in early March, stay-at-home orders were not yet issued for any of the states in the U.S. By late March, the WHO had declared COVID-19 a pandemic, and states had begun to mandate stay-at-home orders. By early May, many states had been under stay-at-home orders for weeks and some had already started to lift the order. By studying individuals across these three key time points, we could gain a better understanding of changes in daily life before, immediately after it started, and then into the pandemic.
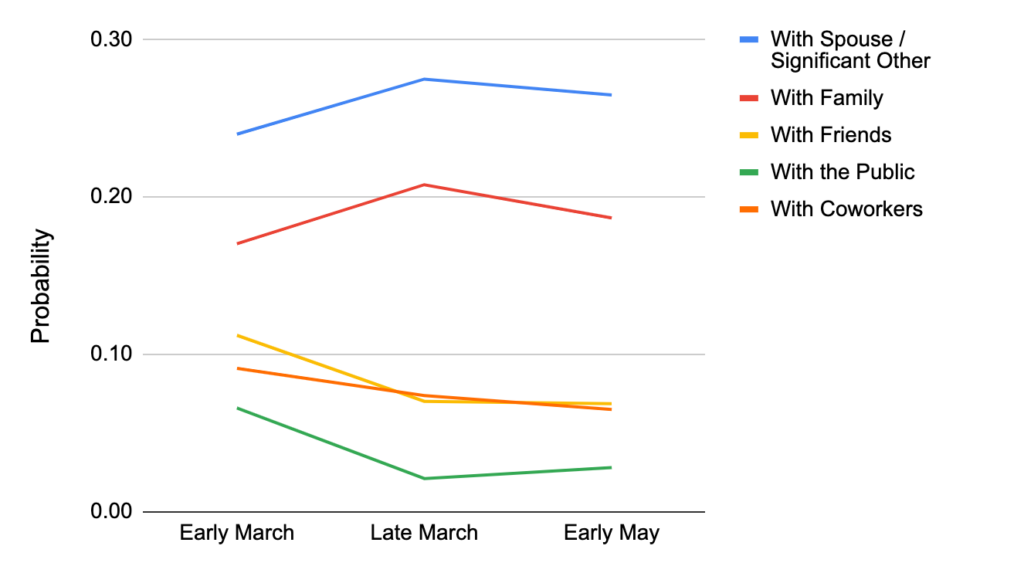
As expected due to the stay-at-home orders, there were substantial increases in the probability of being at home from early to late March (.56 to .79, yielding a 41% increase), and this altered level remained through May (.75). From early to late March, respondents were more likely to be interacting with their spouse/significant other (an increase of 15%) and family (22% increase), but less likely with friends (37% decrease), coworkers (19% decrease), and people in the public (68% decrease) (Figure 1). The likelihood of interacting with all of these groups remained relatively stable from late March to early May, except that participants were less likely to interact with family members from late March to May (10% decrease). The likelihood of interacting with one’s supervisor did not change significantly from March to May (not shown in figure). (All of the results reported here have been adjusted for sample differences.)
Figure 1: The Probabilities of Engaging in Various Social Interactions, March to May 2020
Note: The predicted probabilities or means in all analyses were controlled for age, sex, ethnicity, cohabitation with spouse/partner, education, working status, and income.
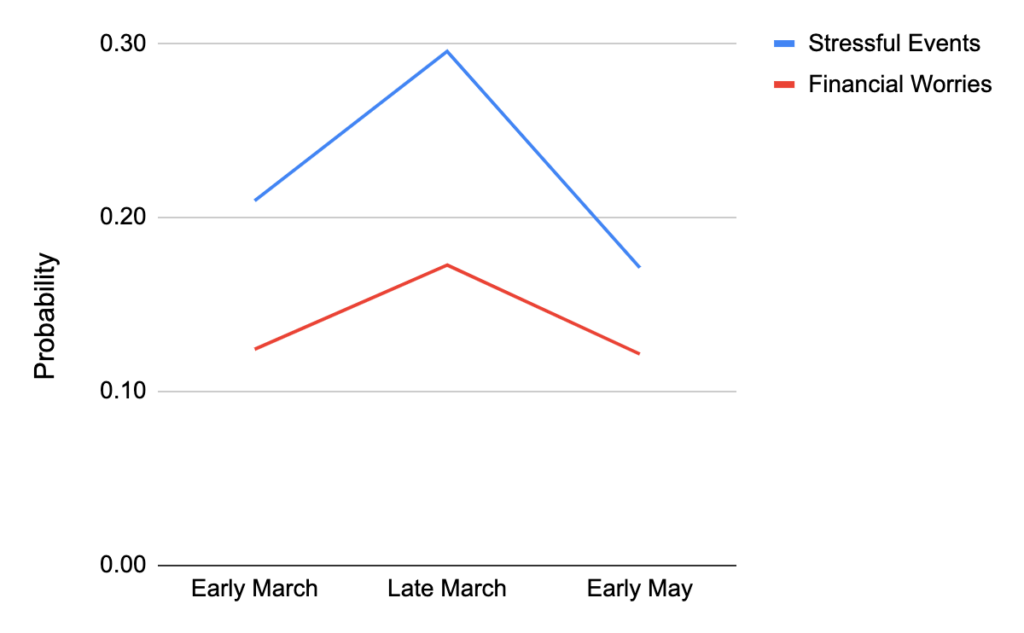
The economic downturn associated with the COVID-19 pandemic has led to a 20% increase in unemployment from early March to early April and it surely threatens the financial security of many individuals. Given the economic challenges and disruptions that the population now faces, we examined the likelihood of experiencing a stressful event or worrying about their finances. We found significant increases in the likelihood of experiencing stressful events (41%) and financial worries (39%) from early March to late March, and returned to initial pre-pandemic levels by May (Figure 2).
Figure 2: The Probabilities of Reporting Stressful Events and Financial Worries, March to May 2020
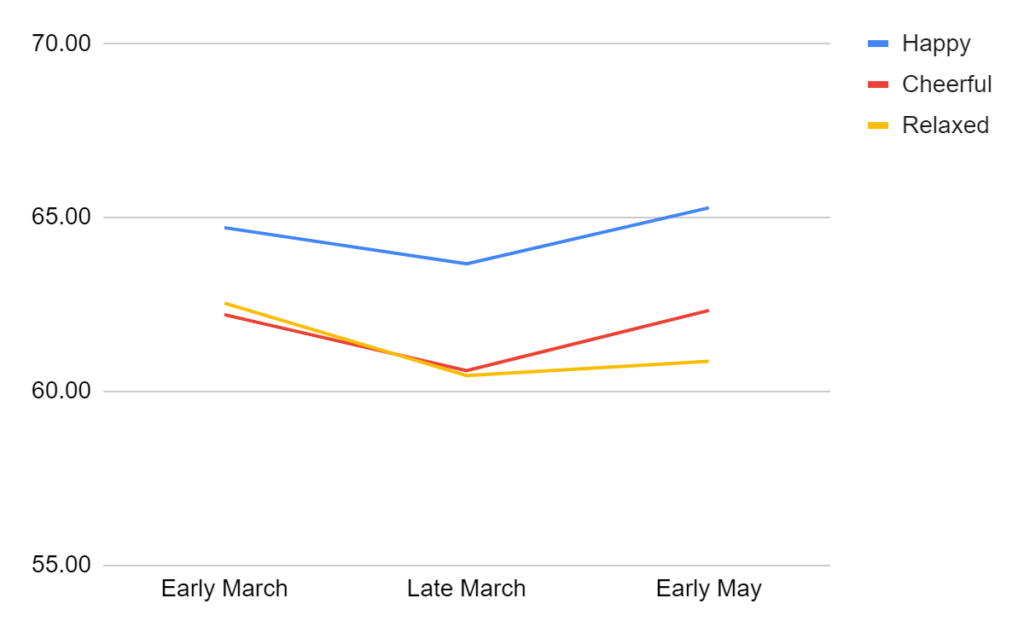
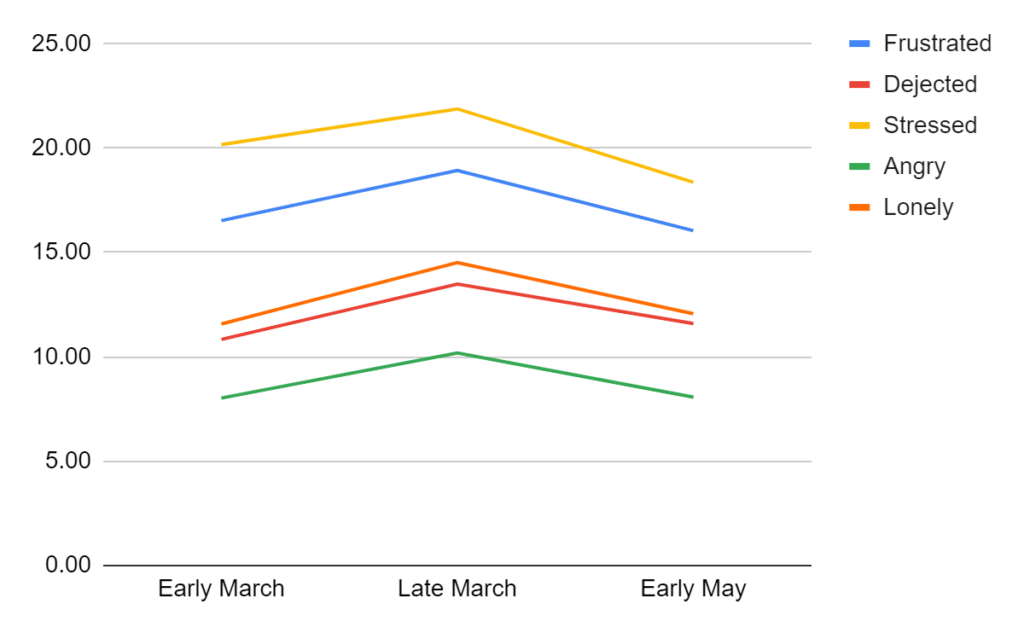
Given all of the disruptions associated with the pandemic, the mental health toll of the COVID-19 pandemic received a lot of attention. We were motivated to understand individuals’ real-time emotional experiences in their daily lives. We found that individuals reported decreases in positive emotions from early to late March, yet there was a return to initial levels of feeling happy and cheerful by May. However, the levels of feeling relaxed remained stable from late March to May (Figure 3). Negative emotions followed the expected pattern and increased from early to late March, then decreased from late March to May. Overall, emotional well-being worsened from before to right after the pandemic started, but then rebounded over the following two months. Similar patterns in mental health have been found in the larger UAS sample. All of these findings suggest possible psychological adaptation over time.
Figure 3: Levels of Positive and Negative Emotions, March to May 2020
Positive Emotions
Negative Emotions
We examined key aspects of daily life in a sample of middle-aged and older adults across the U.S. at the beginning of the COVID-19 pandemic and two months later. Despite sustained changes in where people were, and who they were with, participants’ reports of stressors, financial worries, and emotional well-being only initially worsened, but then had rebounded by May. Overall, the magnitude of changes in the levels of emotional states from pre-pandemic times to immediately after its onset appears small. However, it is difficult to put meaning to this magnitude of change. For instance, the onset of the pandemic was associated with an alarming increase of 41% in the probability of experiencing a stressful event. Interestingly, participants’ average levels of feeling “stressed” only increased by 8%. This suggests that the population’s average emotion levels may be more resistant to change in response to disturbances in the environment.
The rebounding of emotions and stressors from late March to May suggests that individuals may be adapting to the conditions of the pandemic. While this may be a comforting tentative conclusion, it is not clear how people will fare in the long run, especially if it continues for many more months. We are expecting more follow-up data from these participants and will continue to monitor individuals’ behaviors and well-being to understand the consequences of the pandemic on peoples’ lived experiences.
About the survey: The data source for this report is a sub-sample of the larger Understanding America Study (UAS) that focuses on using ecological momentary assessment techniques to track longitudinal changes in individuals’ experiences. The data was collected for a grant from the National Institute on Aging, “Toward Next Generation Data on Health and Life Changes at Older Ages, U01AG054580. The UAS is run by the Center for Economic and Social Research at the University of Southern California (USC) . This research is also supported by R37-AG057685 (AAS, PI).

You must be logged in to post a comment.