Editor’s note: Posts on the Evidence Base Blog are edited for clarity, but have not been subject to a formal, peer-review process.
Summary
Is profitability the only factor that contributes to U.S. drugmakers’ revenue growth? Understanding what drives pharmaceutical firms’ revenue growth is critical to developing evidence-based policies that curb drug costs without reducing the industry’s innovations. We aggregate all publicly listed U.S. pharmaceutical firms’ income statements each year and decompose sales into seven categories: R&D, amortization, cost of goods sold, operating expenses, depreciation, advertising, and operating profits. A time-series analysis from 1979 to 2018 indicates that the U.S. public drugmakers have doubled their sales revenue but tripled their operating profits. More significantly, the industry’s R&D spending increased from $6.3 billion in 1979 to $61.1 billion in 2018 (both in 2018 dollars), a change of nearly ten times. In contrast to the public perception that drugmakers spend more on advertising than R&D, the industry’s advertising expenses shrunk from 6% of sales in 1979 to less than 3% in 2018. Overall, we find that drugmakers’ revenue increase was associated with both increased profitability and greater spending on innovation. Regulations that aim to curb the rise in drug prices should consider their impact on firms’ innovation capacity.
Americans spent $333 billion on prescription drugs in 2017. The number is projected to increase by 73% by 2027. Politicians from both parties have proposed regulations to lower drug costs. However, it is not clear what factors contribute the most to the price increase. A recent public opinion poll conducted by Kaiser reported that 80% of the respondents chose the high profit made by drugmakers as the major contributing factor, 69% chose the cost of research and development, and 52% chose the marketing and advertising expense. In contrast, the American Hospital Association claimed that it is a myth that “high prices are necessary to fund the development of new drugs,” and “eight out of 10 major drug manufacturers spend more on advertising than on research and development.”
In this study, we decompose drugmakers’ sales revenues into major categories to assess what has changed over the past forty years. Our time-series analyses of the same industry overcame the weakness in the between-industry studies. Ledley et al. (2020) compared the profitability of the 35 largest drugmakers in the S&P 500 index with other S&P 500 companies and concluded that drugmakers were much more profitable. Frazier (2020) pointed out that large firms were survivors of market competition, and their statistics might not be representative. Besides, the between-industry comparison is like comparing “apples to oranges” due to the differences in business model and accounting rules. Our time-series analyses of the entire industry overcome the weaknesses of other studies that compare firms between different industries.
Based on 4,923 firm-year observations, we find that U.S. drugmakers’ sales revenue has increased from $139 billion in 1979 to $321 billion in 2018 (both numbers are in 2018 dollars). A large portion of the increases went to profit, increasing from 15.3% of sales in 1979 to 23.4% of sales in 2018. A much larger increase went to research and development (R&D), which increased from 4.6% of sales in 1979 to 19% of sales in 2018. Expenditures on acquiring drugs developed by other companies also increased from 0.1% of sales in 1979 to 5.2% of sales in 2018. These two categories represent the total costs of developing new drugs, both internally and externally. Their combined share of sales in 2018 is 24.2%, almost the same as that of the raw materials and direct labor cost, which has fallen from 48.1% of sales in 1979 to only 25% in 2018. This change reflects that modern medicines’ production has increasingly relied on intangible assets rather than physical inputs.
In contrast to the public perception, drugmakers’ expenditure on marketing or advertising has only increased slightly from $8.4 billion in 1979 to $9 billion in 2018 (both numbers are in 2018 dollars). As a percentage of sales revenue, drugmakers’ marketing expenses have shrunk by half: from 6.1% in 1979 to 2.8% in 2018.
Overall, our statistics indicate that the drugmakers’ revenue composition has changed profoundly. The increase in sales revenues is associated with increased profitability and more spending on innovation. Regulations that aim to curb drug prices should consider their impact on firms’ innovation.
Data and Methods
The Securities Exchange Act of 1934 requires that companies that issue stocks or bonds to the public in the United States or are listed on a U.S. stock exchange must report their annual financial performance to the Securities and Exchange Commission. S&P Global Inc. has extracted these firms’ financial data and standardized them in a widely used commercial database, Compustat, since 1962. From the dataset Company Annual Fundamental, we download the financial data of drug manufacturers that are incorporated and headquartered in the United States, and whose fiscal year ended between January 1, 1979, and December 31, 2018. We identify drug companies by the Standard Industry Classification code of 2834. To facilitate comparisons over time, we adjust all dollar amounts to the 2018 price level using the Consumer Price Index downloaded from the Federal Reserve Bank of Minneapolis. Our final sample includes 4,923 firm-year observations from 1979 to 2018, with an average of 123 firms in each year. We aggregate individual firms’ numbers annually to examine the changes in the pharmaceutical industry over time.
Public companies must prepare their financial statements following the U.S. Generally Accepted Accounting Principles issued by the independent Financial Accounting Standard Board. These statements are audited by independent auditing companies. Misreporting is subject to both a civil penalty and criminal prosecution. Our data’s quality is high compared to data voluntarily provided by drugmakers, such as the survey of Pharmaceutical Research and Manufacturers of America.
Variables:
- Sales revenue is the top line item on a firm’s income statement. It represents the actual billings to customers for regular activities, reduced by discounts, returned sales, and allowances for credit sales. We deduct the following major costs from sales to derive the operating profit:
- Cost of goods sold (COGS) is the raw materials and direct labor cost in making a product. For most manufacturers, COGS is the largest cost component.
- Operating expense (or Selling, General & Administrative expense) is the expense of maintaining firms’ sales and operations, including utilities, legal fees, insurance, and sales and administrative salaries. To track the changes of different type of expenses, we ensure that Operating expense does not include Depreciation, R&D, Amortization, and Advertising expenses (described below).
- Depreciation expense is the annual charges for fixed assets. It is a major cost component for industries that rely on heavy equipment (e.g., construction or airlines).
- R&D, and Amortization expense: In general, accounting standards require firms to record an expense in the same period as the revenue generated. R&D is a major exception. Firms are required to expense R&D as it incurs because R&D’s future benefits can’t be measured precisely at the time of the expenditure. When firms’ R&D eventually leads to patents or other intangible assets, they do not record the value of these assets on the balance sheet because the cost has been recorded in the past through R&D. In contrast, when firms purchase patents or other intangible assets from a third party, they record the purchase price as the value of intangible assets. For intangible assets with a finite life, the annual charges are called Amortization. In other words, R&D represents firms’ cost of developing drugs internally while Amortization measures the annual charge of buying drugs developed externally. Together, they indicate how much a business relies on innovation or intangible assets in generating sales revenue.
- Advertising expense includes the costs of producing and distributing advertisements and sponsoring public events to promote a brand or product. Firms are required to disclose the amount of advertising expense in the note to the financial statement if the amount is material. Operating profit is what remains after deducting the above costs from sales. It is also called EBIT (Earnings Before Interest and Taxes) and is commonly used to assess a firm’s operating performance. Compared to net profit, operating profit is more suitable for comparisons over time because it is not affected by tax rate changes and firms’ use of leverage.
Results:

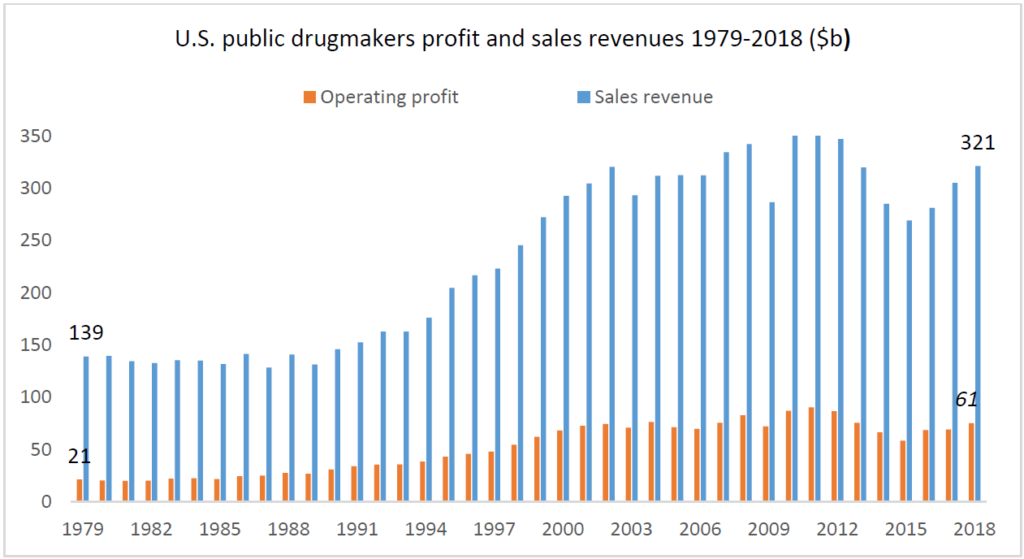
Figure 1 reports public U.S. drugmakers’ total sales revenue and operating profit in constant 2018 dollars. From 1979 to 1985, the industry had flat sales, about $139 billion each year, and then the sales started to grow rapidly. It dropped in 2009, a year of the financial crisis, but rose again and peaked at $361 billion in 2011. The industry experienced a U-shaped growth in the past few years and reached $321 billion in 2018, 2.3 times the revenue in 1979. In contrast, the industry’s operating profit has experienced a steady increase, from $21 billion in 1979 to $75 billion in 2018, a change of 3.5 times.

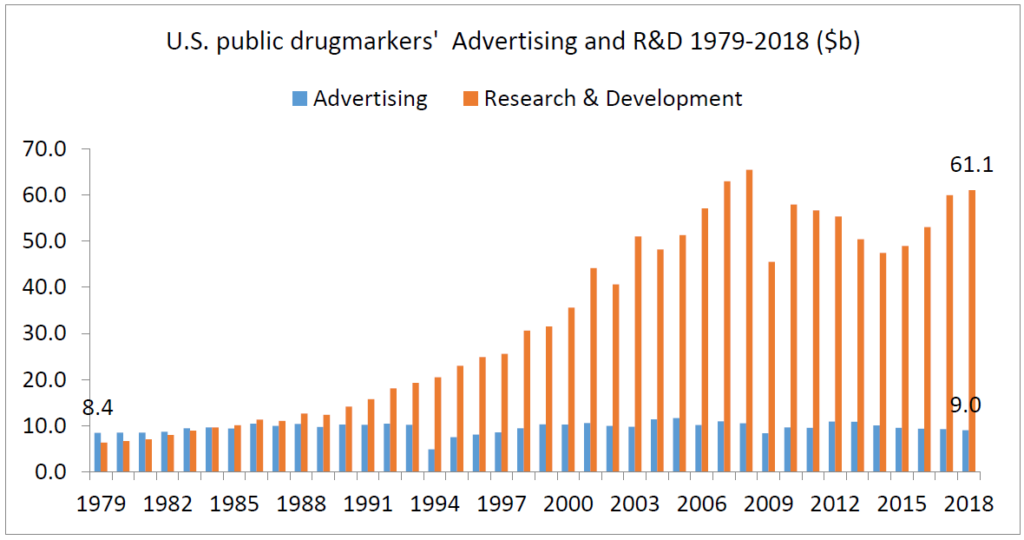
Figure 2 reports drugmakers’ annual expenditures on Advertising and R&D from 1979 to 2018 in constant 2018 dollars. In 1979, the industry spent $8.4 billion on advertising, 33% more than the R&D expense of $6.3 billion. Drugmakers continued to spend more on advertising than R&D from 1980 to 1982. Since then, R&D expenses exceeded advertising expenses every year from 1983 to 2018. In 2018, drugmakers spent $9 billion on advertising, only 15 percent of the R&D expense of $61.1 billion. The numbers contradict the public perception that drugmakers have spent more on advertising than R&D. In fact, drugmakers’ R&D increases are remarkable. It has increased from $6.3 billion in 1979 to $61.1 billion in 2018, a change of nearly ten times.
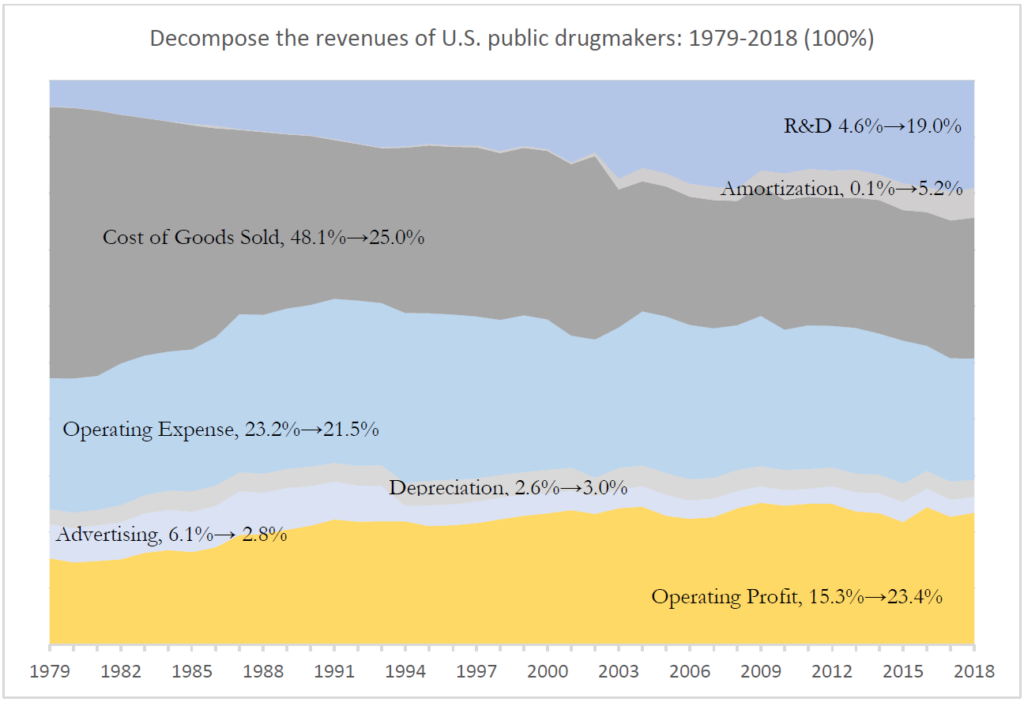
To better understand the changes over time in drugmakers’ cost structure, we report the major cost components and the remaining profitability as a percentage of sales in Figure 3. R&D was only 4.6% of sales in 1979 but reached 19% in 2018. Amortization expense also increased from less than 0.1% in 1979 to 5.2% in 2018. Together, these two expenses reflect drugmakers’ annual spending on innovation. Their combined percentage of sales in 2018 is 24.2%, almost the same as the largest cost component, cost of goods sold, 25% of sales. These numbers indicate that modern medicines’ production has increasingly relied on intangible assets rather than physical inputs.

Two major cost components have declined dramatically. The raw materials and direct labor cost (i.e., cost of goods sold) have reduced from 48.1% of revenue in 1979 to only 25% in 2018.
Adverting expenses dropped from 6.1 % of sales in 1979 to 2.8% in 2018. The remaining two cost components have changed little in the past forty years. The operating expenses decreased slightly from 23.2% in 1979 to 21.5% in 2018. Depreciation expense had increased slightly from 2.6% of sales in 1979 to 3% in 2018.
After deducting all production costs, the drugmakers’ operating profit increased from 15.3% of sales in 1979 to 23.4% in 2018. This evidence is consistent with the public’s perception that drugmakers’ profit is a major factor contributing to increased drug prices.
Discussions
From 1979 to 2018, the U.S. drugmakers doubled their sales revenue but more than tripled their operating profits. Their cost structure also changed dramatically. The cost of goods sold, operating expenses, advertising, and depreciation declined from 80% of sales in 1979 to 52% of sales in 2018. In contrast, R&D spending increased from 4.6% of sales in 1979 to 19% in 2018. In 2018 dollars, drugmakers’ R&D spending increased by tenfold, from $6.3 billion in 1979 to
$61.1 billion in 2018. Amortization of intangible assets also increased from 0.1% of sales to 5.2% of sales. In contrast to the public perception that the advertising expense is a significant driver of drug prices, drugmakers’ marketing expense has remained constant in terms of dollar amount and was cut in half as a percentage of sales (from 6.1% to 2.8%). Overall, our results suggest that higher drug prices not only benefited drugmakers’ bottom line but also supported their growing spending on innovation.[1]
This innovation spending may not be direct by the company, but can also be done in the form of acquisitions of smaller companies. A significant share of pharmaceutical innovation today is occurring in companies with less than $200 million in R&D expenses and less than $500 million in global revenue. These companies accounted for 42% of new drugs and 73% of all late-stage research in 2018. Large companies frequently purchase these smaller companies with promising drug candidates, infusing necessary capital into the product’s development that allows the product to continue clinical trials. Alternatively, these larger companies may seek alternative investment strategies, including establishing separate venture capital funds to invest in needed but risky products, such as new generations of antibiotics. While some scholars criticize this activity as anti-competitive and bad for patients, infusion of this capital is necessary if smaller, innovative firms are to be able to finance the $2.6 billion average cost of drug development. Any policies that aim to curb drug prices should consider their impact on drug companies’ innovation.
Limitations
Our analyses have the following limitations. We only consider public U.S. pharmaceutical companies. Private companies such as Purdue Pharma are not in our sample. Also, our data couldn’t separate sales generated in the United States from sales from other countries. Our advertising expenses might underestimate firms’ actual expenses on marketing. We report advertising expenses following generally accepted accounting principles, whose definition is
more specific and narrower than general marketing expenditures. For example, it only includes the cost of producing and distributing advertisements on TV, radio, newspaper, and internet (i.e., Direct to Consumer). The salaries of sales personnel and firms’ spending on physician education are not included. In addition, firms do not need to disclose advertising expenses if the amount is not material.
John (Xuefeng) Jiang is a professor in the department of accounting and information systems at Eli Broad College of Business, Michigan State University. Jing Kong is a Ph.D. candidate at the Eli Broad College of Business. Joe Grogan is a nonresident senior fellow at the Schaeffer Center and founder and owner of Fire Arrow Consulting, specializing in healthcare and life sciences consulting services.
Footnote
[1] This increased spending on innovation might be necessary since it becomes harder to create ideas, as documented by this paper.

You must be logged in to post a comment.