Editor’s Note: This analysis is part of the USC-Brookings Schaeffer Initiative for Health Policy, which is a partnership between Economic Studies at Brookings and the University of Southern California Schaeffer Center for Health Policy & Economics. The Initiative aims to inform the national health care debate with rigorous, evidence-based analysis leading to practical recommendations using the collaborative strengths of USC and Brookings.
Through a grant from Arnold Ventures, the USC-Brookings Schaeffer Initiative is working to critically evaluate the prevalence, drivers, and policy implications of surprise medical billing, as well as develop potential nonpartisan policy solutions.
The New York Department of Financial Services (DFS) recently released a trove of data that helps shed light on experiences with the state’s arbitration process to resolve surprise out-of-network bills through 2018. These data suggest that the state’s arbitration process is substantially increasing what New Yorkers pay for health care.
In April 2015, New York implemented one of the first state laws addressing surprise out-of-network billing at in-network facilities in both emergency and non-emergency situations (other than a few exemptions). Patients enrolled in fully-insured, state-regulated health insurance products can now contest surprise bills in these situations, in which case the patient is only responsible for in-network cost-sharing amounts. If the insurer and out-of-network provider(s) are unable to agree on a payment amount, disputes are settled by a final-bid, “baseball-style” arbitration process – what the state refers to as independent dispute resolution (IDR) – in which the arbiter must decide whether final payment should be the insurer’s initial allowed amount or the provider’s charges.
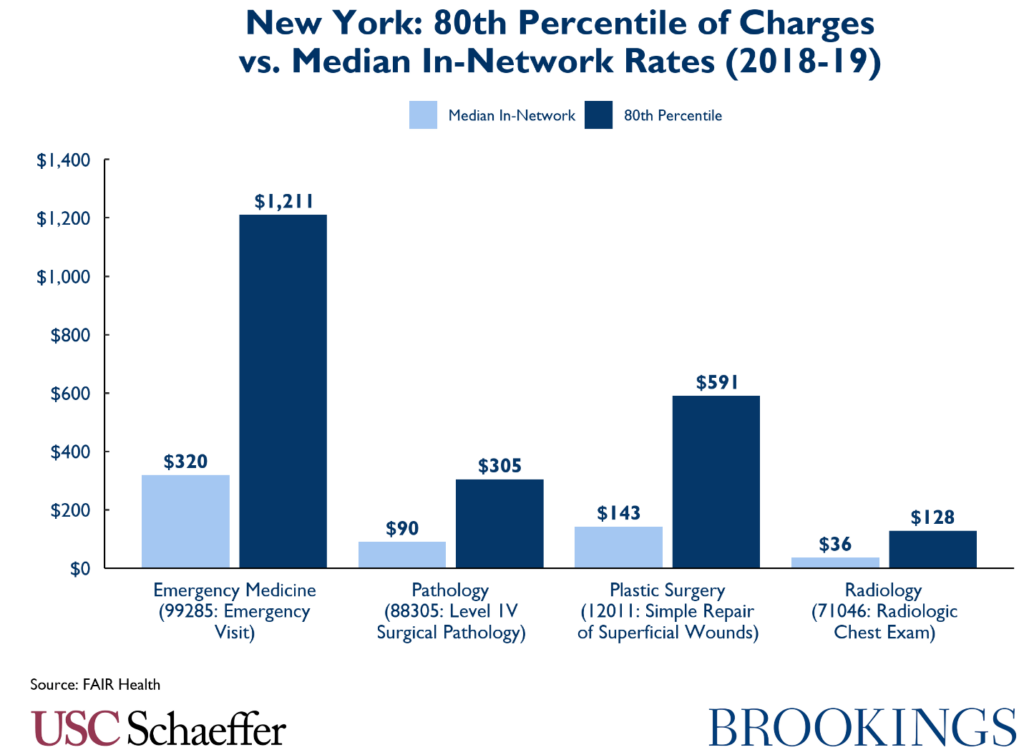
The biggest concern raised about NY’s arbitration process is the state’s guidance that arbiters should consider the 80th percentile of billed charges (as calculated by FAIR Health, an independent insurance claims database) when determining the final payment amount. Providers’ billed charges, or list prices, are unilaterally set, largely unmoored from market forces, and generally many times higher than in-network negotiated rates or Medicare rates. And telling arbiters to focus on 80th percentile of charges—that is, an amount higher than what 80% of of physicians charge for a given billing code—drives this standard still higher.
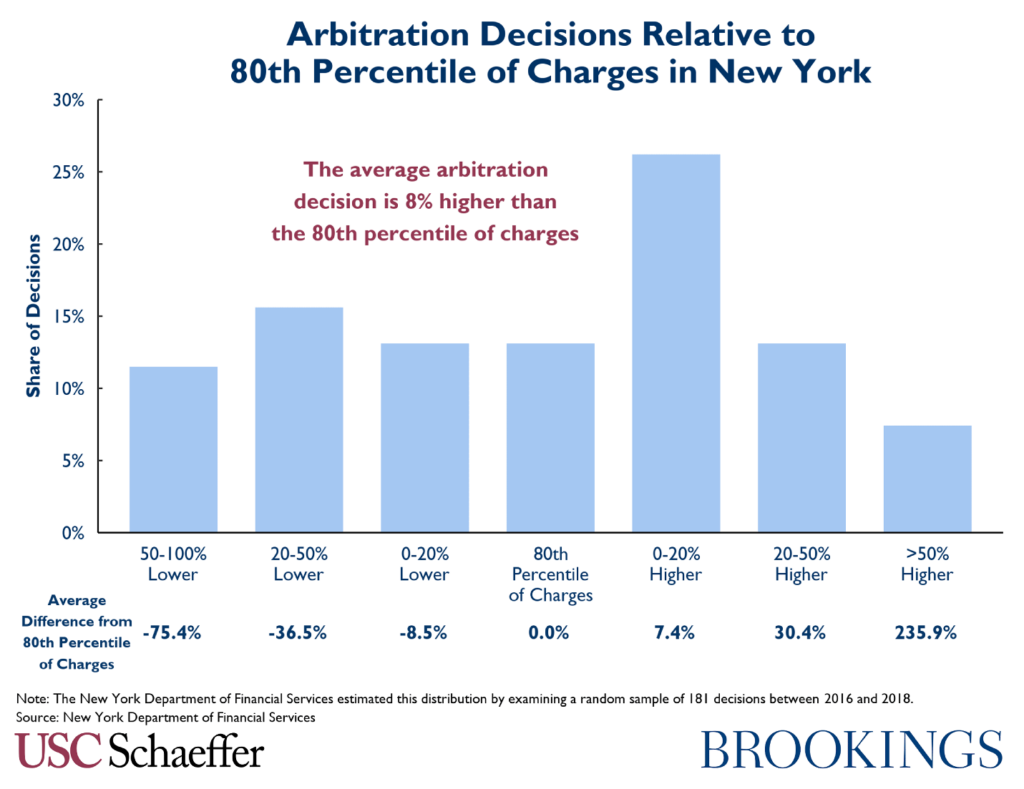
The New York Department of Financial Services report finds that arbitration decisions have averaged 8% higher than the 80th percentile of charges.
The 80th percentile of charges is only one piece of guidance given to arbiters in NY, so there was initially some hope that arbiters might eschew this clearly inflationary guidance. Unfortunately, however, the New York Department of Financial Services report finds that arbitration decisions have averaged 8% higher than the 80th percentile of charges.
Therefore, it is likely that the very high out-of-network reimbursement now attainable through arbitration will increase emergency and ancillary physician leverage in negotiations with commercial insurers, leading either to providers dropping out of networks to obtain this higher payment, extracting higher in-network payment rates, or some combination thereof, which in turn would increase premiums. If insurers are additionally increasing out-of-network payment for services in order to reduce the risk of losing in arbitration, that would further amplify this inflationary impact on premiums. Forthcoming research with coauthors will examine these effects.
Of note, the NY DFS report includes an estimate that the New York law has saved consumers over $400 million, but there is no supporting evidence provided and the actual data released in the report strongly suggests that the opposite is true.
Appendix A. Growth and Breakdown of Arbitration Decisions
The broader implications are less clear, but the NY DFS report also illustrates how often the arbiter is selecting either the health plan or provider offer. Unfortunately, though, they do not break this out by service (often multiple services from the same provider are being arbitrated at the same time), which makes it more difficult to interpret trends over time, especially given the inclusion of a sizable “split decision” category.
While these graphs break out whether the insurer or provider “won” in arbitration, it is important to note that consumers and taxpayers appear to be “losing” in either instance. That is, even arbitration decisions in favor of the health plan have averaged only 11% below the 80th percentile of charges, still far above in-network rates or typical out-of-network payments – implying that health plans only “win” in arbitration when they offer to pay extremely high rates, which is then paid for through higher premiums.
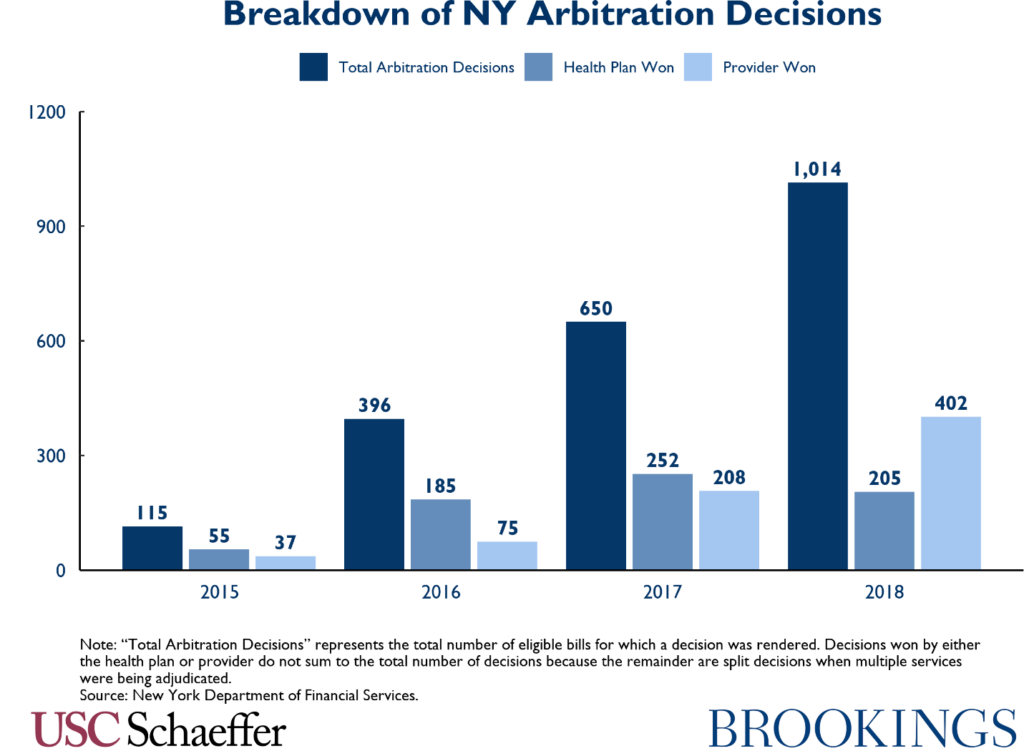
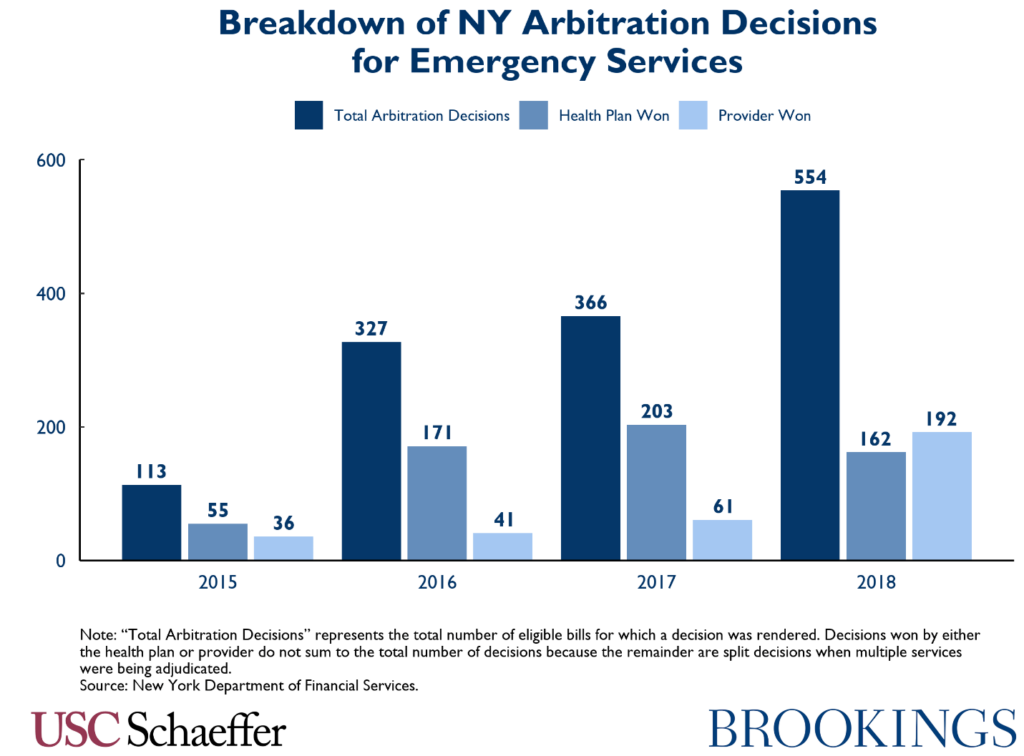
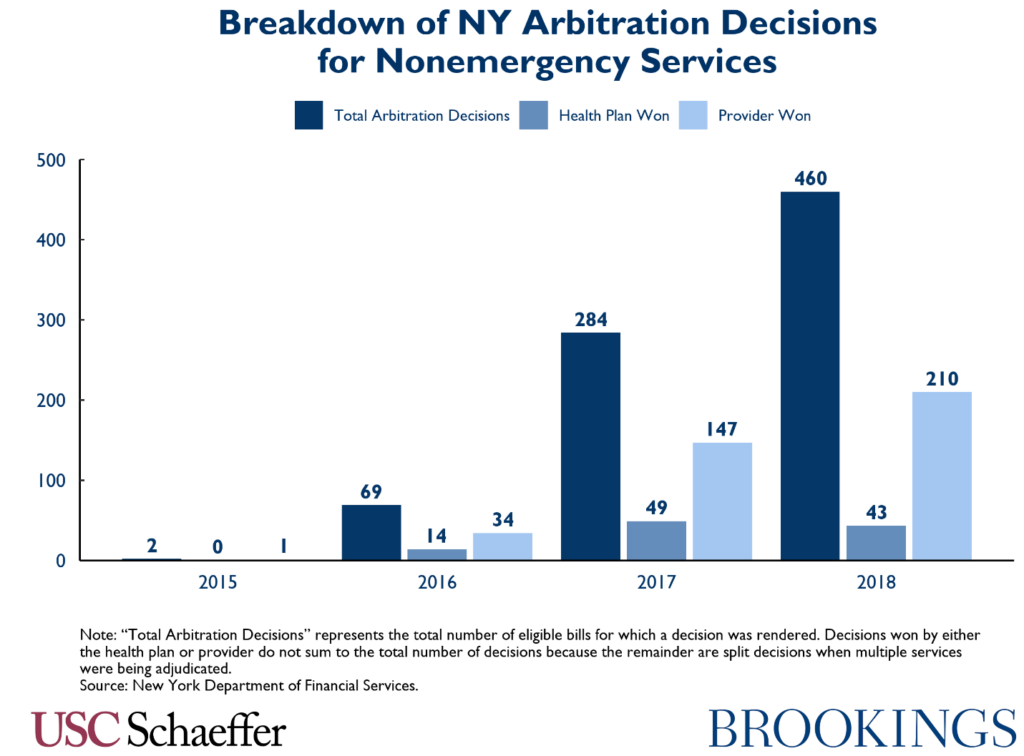
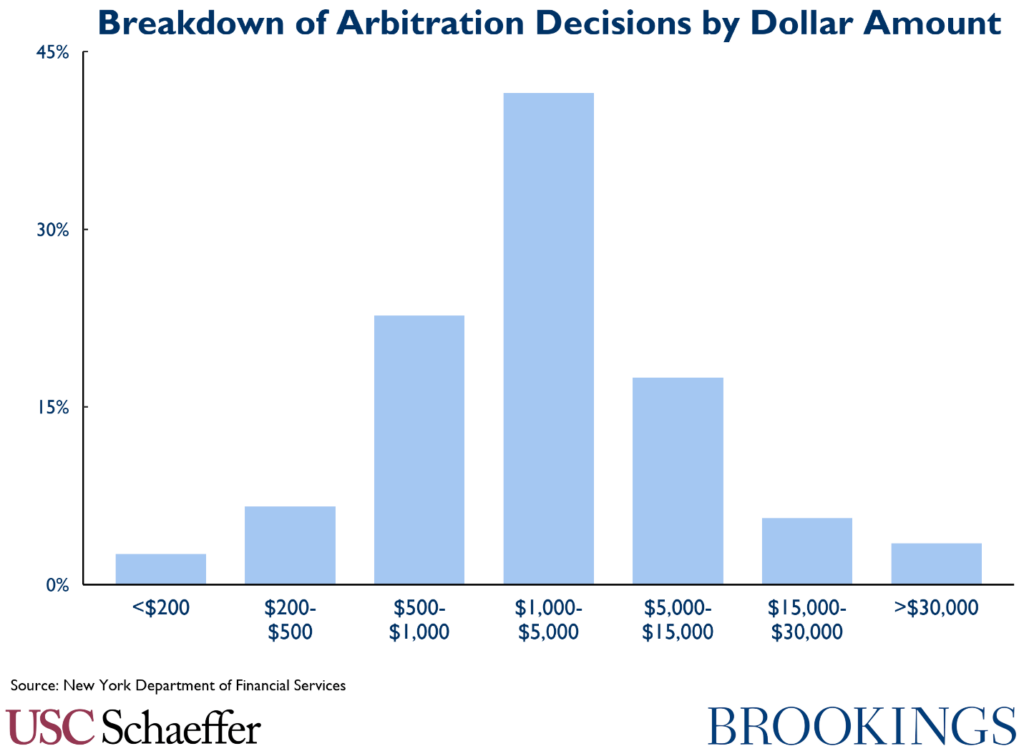
As we can see, more bills have gone to arbitration each year, but it is unclear whether this results from more providers taking advantage of how lucrative the process is, growing awareness of New York’s law among patients, or a combination thereof. Nonetheless, the growth does imply that the system has not yet reached equilibrium, as the number of decisions should start to decline once both parties know how the arbiter will decide. The 1,000 arbitration decisions in 2018 still represent a small share of out-of-network bills, although many of the decisions involve multiple services and high dollar amounts (as can be seen in the following graph). It will be useful to monitor growth in the number of bills brought to arbitration over time.
Appendix B. Who Uses Arbitration in New York?
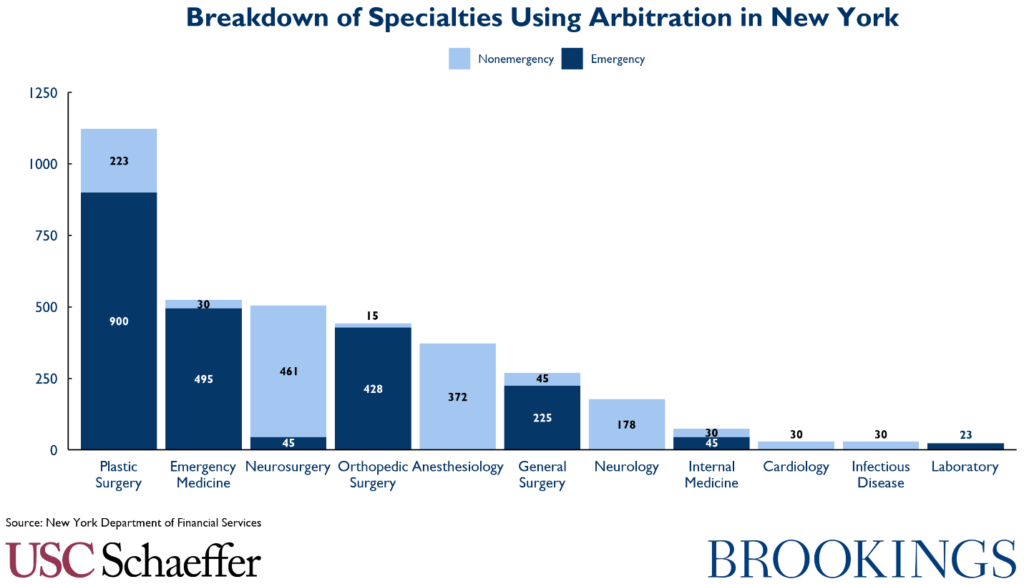
The mix of specialists utilizing arbitration in New York is different than what many imagine for the overall breakdown of surprise out-of-network bills. Plastic surgeons in the emergency room are actually the most common utilizer, although the two main specialties typically thought of in the context of surprise out-of-network billing – emergency medicine and anesthesiology – are frequent users as well.

You must be logged in to post a comment.