Key Takeaways
- The COVID-19 pandemic has imposed significant and far-reaching health and economic costs.
- We model and monetize the health-related benefits of two hypothetical treatments administered either before or after hospitalization; both generate substantial value.
- A hypothetical treatment administered outside the hospital that reduces hospitalization risk by 50% results in 285,000 fewer hospitalizations, up to 71,000 fewer deaths, and up to $88 billion in value by the end of 2021.
- A hospital-based treatment that reduces mortality and length of stay by 30% saves 51,000 to 85,000 lives, and generates up to $106 billion in value by the end of 2021.
Abstract
The health impacts of the COVID-19 (C-19) pandemic are significant and far-reaching, including direct expenditures to care for those infected and losses from disease-related mortality and morbidity. C-19 has also imposed broader costs through the mitigation policies implemented to reduce disease transmission, which have dramatically reduced economic activity. We model and monetize the health-related benefits (health outcomes and costs) of two hypothetical C-19 treatments, assuming that each is introduced in the U.S. in Q3 2020, 5% of the population will be infected through June 2020 and 20% of the population will be infected through 2021. A hypothetical treatment for mild disease that reduces hospitalization risk by 50% results in 285,000 fewer hospitalizations, 43,000 to 71,000 fewer deaths and $57 billion to $88 billion in value. A hospital-based treatment that reduces mortality and length of stay by 30% saves 51,000 to 85,000 lives and generates $68 billion to $106 billion in value, the majority of which is due to mortality effects. Although substantial, these gains may be a small share of the total value an effective treatment could generate if it enables the economy to reopen earlier or faster. Efforts to develop effective treatments should be prioritized alongside vaccine development, since treatments for both mild and severe disease can generate substantial value even after a vaccine becomes available.
A press release about this white paper is available here.
Introduction
The COVID-19 (C-19) pandemic has created an urgent need for an effective vaccine or treatment. In the U.S. alone, the disease is responsible for more than 130,000 deaths in the six months since January 2020, with that number growing daily.[1] Patients with severe C-19, even if they eventually recover, often require extended hospitalizations, including long stays in intensive care where costs can exceed $10,000 per day.[2] Despite state and local efforts to slow the spread of the virus, transmission is likely to continue until a vaccine is developed, or until natural infection raises population seroprevalence to the herd immunity threshold of 50–70%.[3] With serology tests suggesting that only 5–8% of the U.S. population currently has antibodies[4], herd immunity will only be achieved at enormous cost in terms of illness and death.
Given the urgent and growing need for a therapeutic, drug developers have jumped quickly into the breach — 163 C-19 vaccines were in development and 239 potential treatments under investigation as of mid-June 2020.[5] Potential treatments under investigation include drugs that are already approved to treat other conditions and drugs still in development. Several classes of drugs are being investigated for potential treatments, including convalescent plasma, monoclonal antibodies, immune modulators and antivirals. To date, only two drugs have demonstrated a therapeutic effect against C-19 in randomized clinical trials: the antiviral remdesivir, and the common steroid dexamethasone.[6,7]
The critical need for effective treatments and the volume of urgent activity to find them underscore the tremendous potential value of an effective therapeutic. This value predominantly comes from two sources: health-related benefits and economy-related impacts. Health-related benefits include increased quality-adjusted life years (QALYs) that result from reducing mortality, symptom severity and duration. Benefits also include savings in healthcare expenditures that result from shorter hospital stays and less intensive use of healthcare resources generally.
The lockdowns, shelter-in-place orders and other social-distancing policies that governments have implemented to constrain the spread of C-19 have also imposed enormous economic costs on society.[8] If the availability of an effective treatment enabled earlier or faster relaxation of those policies, the resulting economic benefits could easily dominate the health-related benefits of treatment.
In this paper, we model the health-related benefits to the U.S. population of two hypothetical treatments for C-19 — one that is effective in mild disease, and one that benefits hospitalized patients with more severe disease. While we do not model the size of the potential economic impact of effective therapy, we provide some rough calculations in the discussion section to show how these may compare with the health-related benefits.
Methods
Model Structure
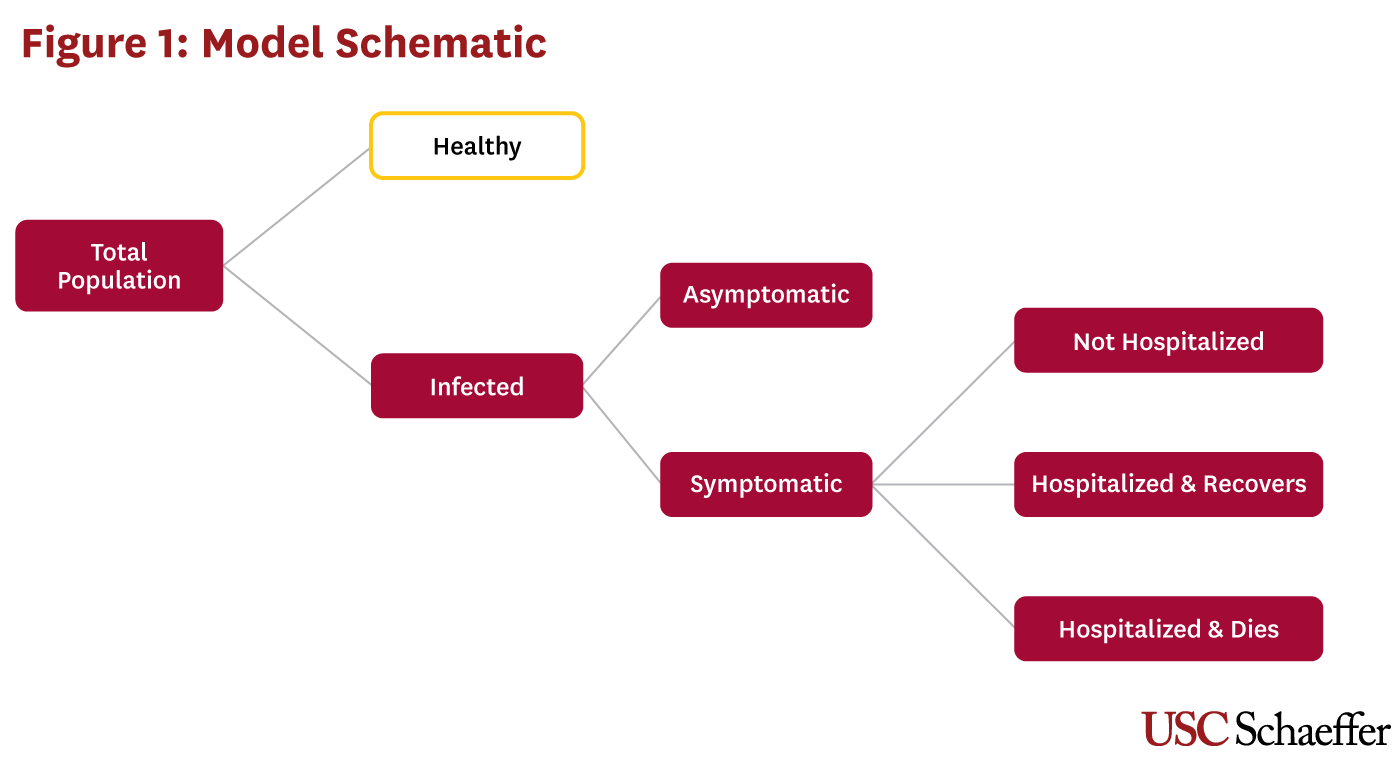
We estimate the health outcomes and healthcare cost impacts of a hypothetical treatment for C-19 using a static model represented in Figure 1. In the model, a share of the total U.S. population is infected and patients fall into one of four categories: asymptomatic, symptomatic but not requiring hospitalization, symptomatic and hospitalized who recover, and symptomatic and hospitalized who die.[i] Asymptomatic patients incur no healthcare costs, while symptomatic patients incur healthcare costs that depend on their hospitalization status. We calculate the mortality costs associated with expected life years lost when an infected patient dies, stratified by patient age group.
Model Parameters and Outcomes
The model is parameterized with age-specific values (where available) taken from the scientific literature. Our model assumes a 20% attack rate (the share of the population that becomes infected over a specified period of time) over two years, and that 35% of these cases are asymptomatic.[9] We use hospitalization and mortality values from the U.S. Centers for Disease Control and Prevention’s (CDC) Pandemic Planning Scenario 5, which represents their “current best estimate about viral transmission and disease severity.”[9] Given current uncertainty surrounding the mortality effects of C-19, we present results using multiple mortality rates. Table 1 provides the model parameter values and their sources. We model population outcomes, including the number of patients infected, symptomatic and hospitalized, and the number of C-19 deaths. Hospitalization and outpatient costs are calculated, as well as mortality costs associated with C-19, which are measured in terms of QALYs. QALYs are discounted at 3% and valued at $150,000.
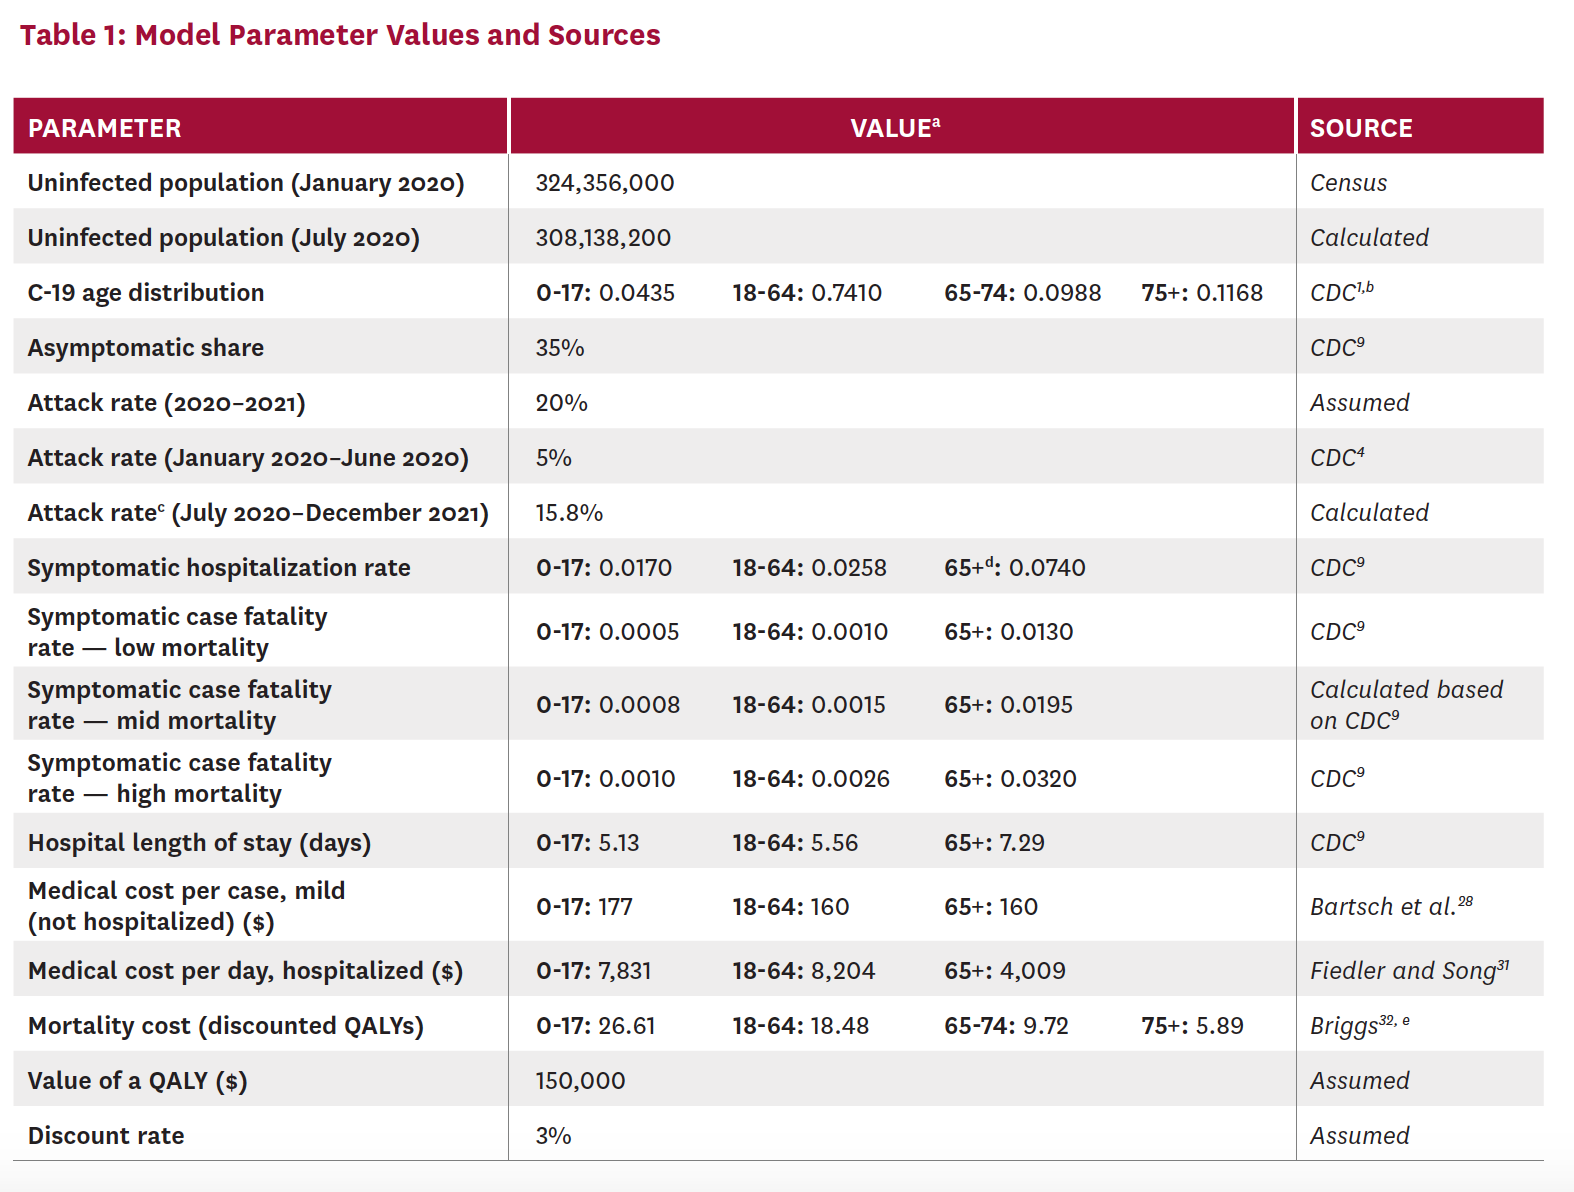
b The CDC updates age distribution data regularly. Our parameter values were accessed on June 10, 2020.
c Results for the treatment scenarios are estimated for July 2020 through December 2021. Using the 5% attack rate for January 2020 through June 2020, we derive the implied attack rate (15.8%) for the remaining model period (July 2020 through December 2021) such that the total number of cases for 2020–2021 correspond to our assumed attack rate of 20%.
d While CDC reports statistics by age groups, including more granular categorization of the older population (65–74, 75–84 and 85+), these are combined in the CDC planning scenarios into one parameter for everyone 65 and older.
e Discounted QALYs were calculated using a standardized mortality ratio equal to one and discount rate of 0.03.
Treatment Scenarios
Our study considers the first two years of the pandemic, through the end of 2021, or the period before an effective vaccine becomes widely available.[ii] We assume that a hypothetical treatment becomes available in Q3 2020, and model alternative treatment scenarios (including a baseline with no treatment) for the 18 months from July 2020 to December 2021. Although widespread treatment availability by Q3 2020 is a simplifying assumption, remdesivir was being used to treat C-19 in the U.S. in early 2020,[12] and availability has been increasing rapidly — 190,000 treatment courses of remdesivir were available by July 2020, with plans to produce more than 2 million treatment courses by December 2020.[13] Dexamethasone is already a widely available generic drug that has been in use since the 1960s.[14] In August 2020, clinical trials will begin for an inhaled version of remdesivir that could be administered outside the hospital at earlier disease stages.[15]
We reduce the model starting population size to account for the number infected prior to July 2020. Based on widespread antibody testing, the CDC estimates that more than 20 million Americans had been infected with C-19 by late June 2020, roughly 10 times the number of confirmed cases.[4] Using this estimate, we assume that 5% of the population was infected with C-19 prior to July 1. This leaves 95% of the population, or 308 million people, susceptible when treatment becomes available. We calculate the attack rate necessary over the 18-month period from July 2020 to December 2021 to result in 20% of the total population having been infected since the start of the pandemic.
In addition to a baseline scenario in which no treatment is available, we estimate two scenarios in which patients are treated with hypothetical therapies. Scenario 1 is modeled loosely after flu antiviral therapies such as Tamiflu (oseltamivir phosphate) that are administered to patients early in the course of the disease and reduce disease severity and, in turn, mortality. Scenario 2 is modeled after therapies such as remdesivir and dexamethasone, which are administered in hospital settings and have demonstrated therapeutic effect in randomized clinical trials.[6,7]
SCENARIO 1: Among symptomatic patients, reduces the probability of hospitalization by 50%; available to 50% of non-hospitalized symptomatic patients
SCENARIO 2: Among all hospitalized patients, reduces both length of stay and mortality by 30%
Scenario 1 increases outpatient costs relative to no treatment, while both treatment scenarios involve hospital cost savings — Scenario 1 reduces the number of hospitalizations, and Scenario 2 shortens hospital stays, thereby reducing costs. Both scenarios also reduce deaths relative to no treatment, which translates into QALY gains.
Sensitivity Analyses
We performed sensitivity analyses on key parameter values, including the share of asymptomatic patients, the attack rates for the full model time frame (2020–2021) and the six months through June 2020, the value of a QALY, the number of QALYs gained when treated patients recover and the share of hospitalized patients who receive treatment.
Results
Table 2 presents population outcomes during the first two years of the pandemic (2020–2021), assuming no treatment is available for three different mortality parameters. For all mortality parameter values, 64.9 million people are infected and 42.2 million are symptomatic. The first row shows outcomes when values from the CDC’s best estimates (Planning Scenario 5) are used for hospitalization and mortality parameters, including an overall symptomatic case fatality rate (SCFR) of 0.004. Other sources have suggested that this fatality rate may be too low: This parameter set results in an estimated 151,725 total deaths by the end of 2021, while there were at least 130,000 deaths as of early July 2020,[1] and some are projecting 200,000 deaths by the end of September 2020.[16]
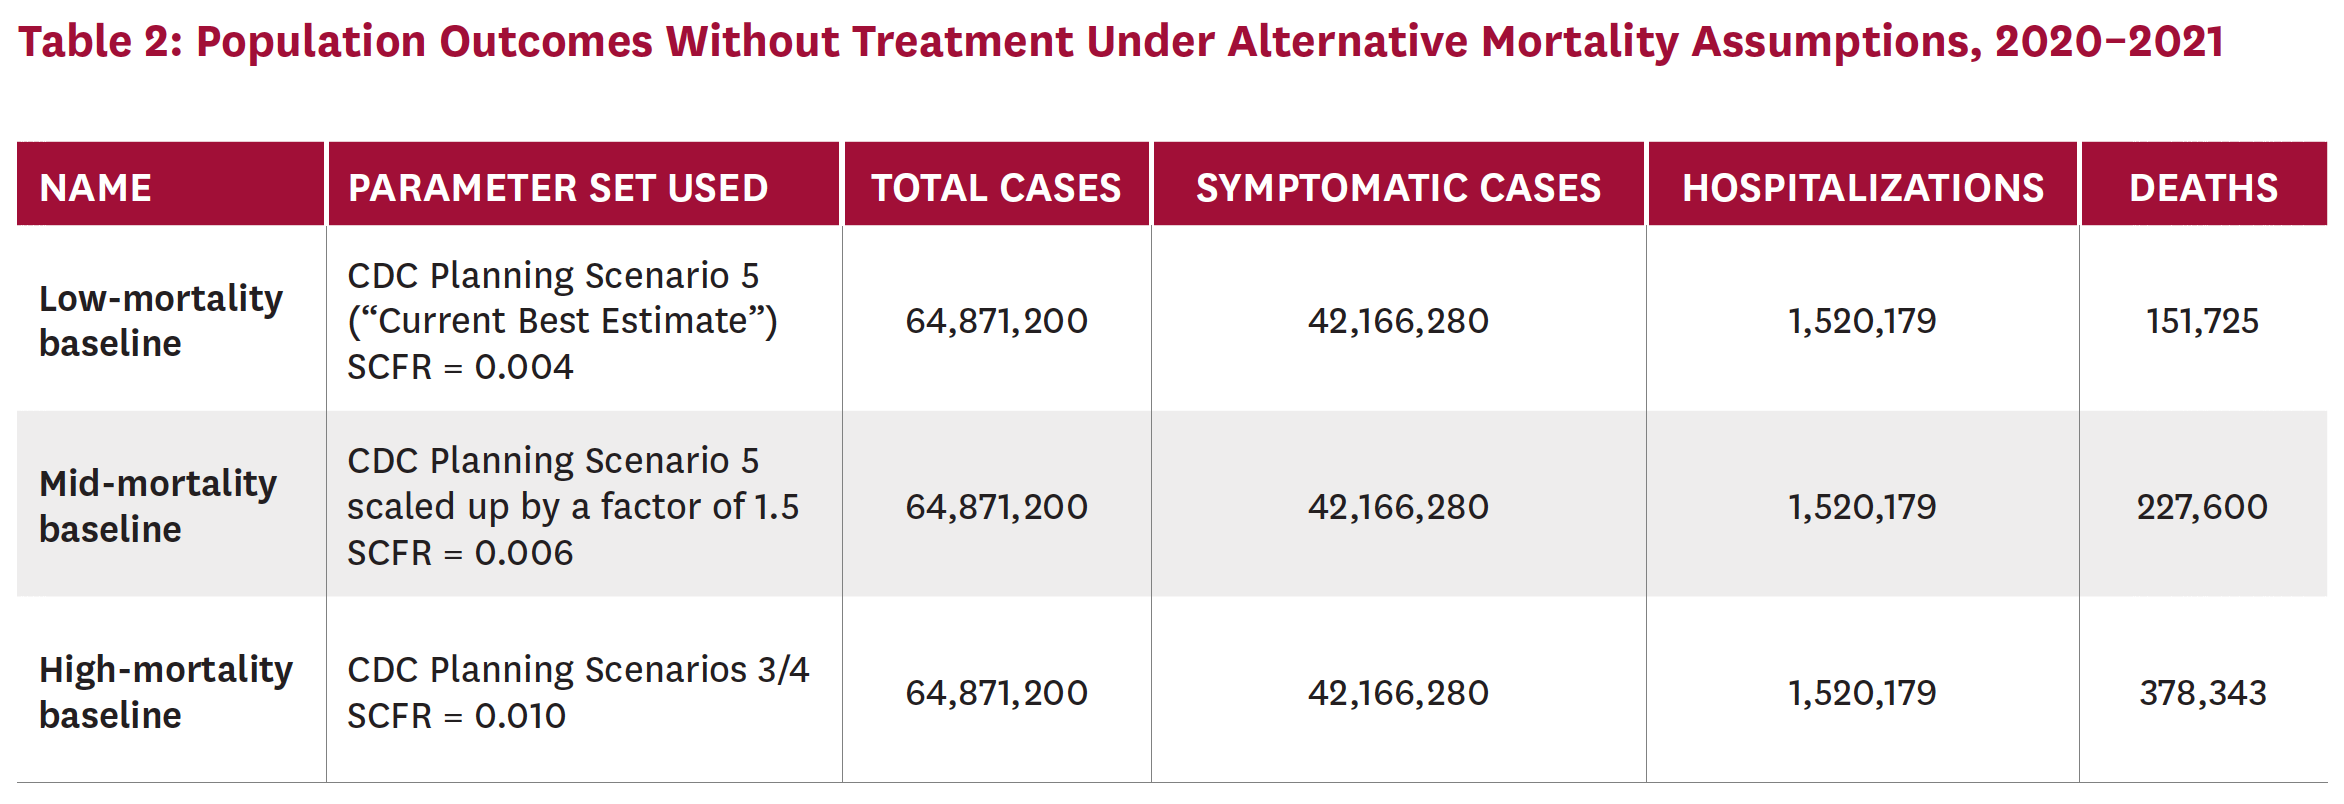
For this reason, we calculate results using higher SCFRs. The last row of Table 2 uses the highest SCFR among the CDC’s planning scenarios, 0.010 (from Planning Scenarios 3 and 4), and predicts 378,343 deaths for 2020–2021. The second row uses an intermediate SCFR of 0.006 and predicts 227,600 deaths. Both the mid- and high-mortality estimates are more consistent with the number of deaths to date. In the analyses that follow, we present results relative to no treatment using both mid- and high-mortality parameter values.
Figure 2 illustrates the number of patients treated, hospitalized and dead between July 2020 and December across all scenarios. The number of patients treated varies widely because Scenario 1 administers therapy to symptomatic patients who are not hospitalized (who represent most of the symptomatic population), while the hypothetical treatment in Scenario 2 is only administered to hospitalized patients. The number of patients hospitalized in Scenario 1 is lower than that in Scenario 2 because the treatment is assumed to reduce hospitalization rates. The number of deaths in both scenarios is presented using both mid- and high-mortality rates, and is lowest in Scenario 2, where the treatment — given only to hospitalized patients — reduces mortality directly.
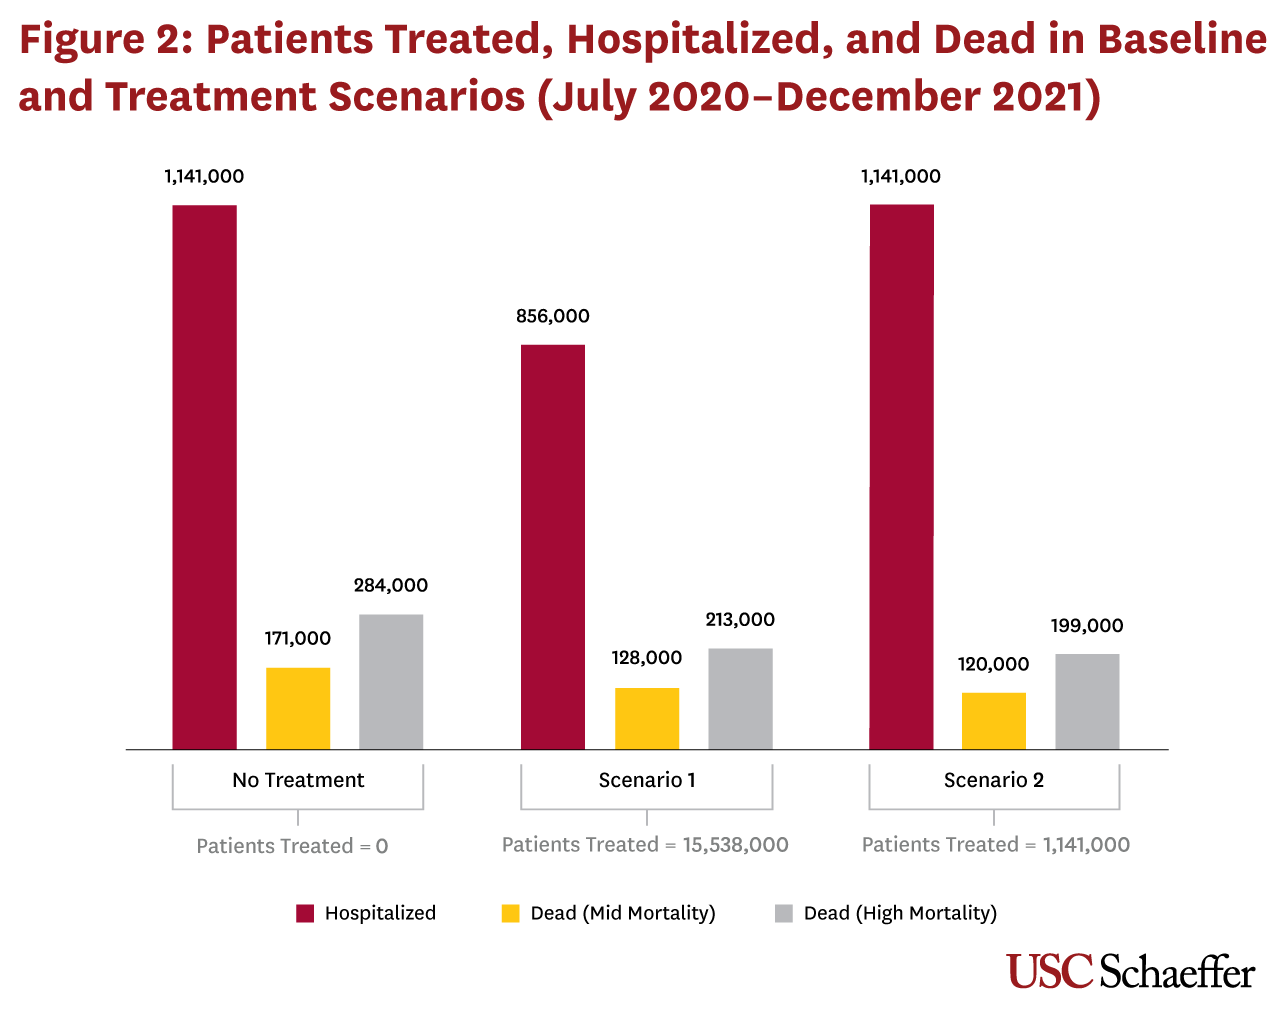
Relative to no treatment, Scenario 1 reduces hospitalizations by 285,000 and deaths by 43,000 (mid-level mortality) to 71,000 (high mortality). Scenario 2 does not reduce hospitalizations but results in 51,000 to 85,000 fewer deaths.
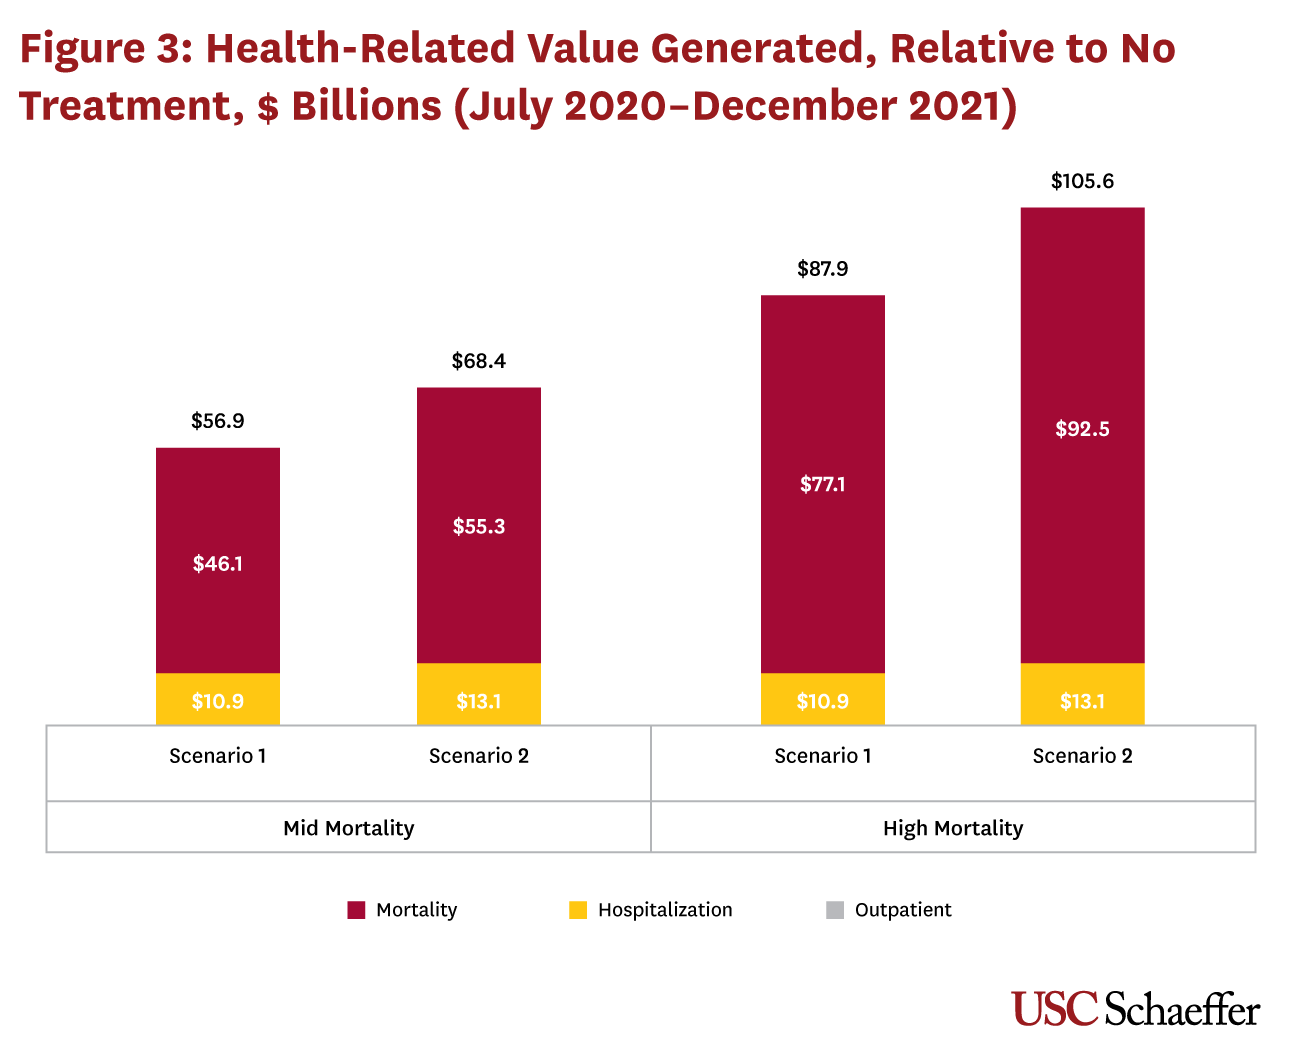
Figure 3 shows the total savings under each treatment scenario compared to no treatment, with results presented for both mid- and high-mortality parameters. Outpatient cost increases are negligible in Scenario 1, and zero in Scenario 2. Gains from reduced mortality account for the majority of the total savings from both scenarios. Scenario 1, which treats non-hospitalized patients, generates $10.9 billion in hospital cost savings from reduced admissions and $46.1 billion to $77.1 billion in monetized gains from reduced mortality, depending on the mortality rate assumed. The total savings relative to no treatment from Scenario 1 range from $56.9 billion to $87.9 billion. Scenario 2, in which all hospitalized patients receive a treatment that reduces both average length of stay and mortality risk, generates $13.1 billion in hospital cost reductions and $55.3 billion to $92.5 billion in monetized gains from reduced mortality, for a total of $68.4 billion to $105.6 billion in gains, depending on the underlying mortality rate assumed.
Discussion
We find large benefits from the direct health impacts of a new treatment for C-19. The value depends on the characteristics of the therapy, but treatments for both mild and serious disease deliver tens of billions in gains, assuming 20% of the population is infected with C-19 by the end of 2021. Regardless of whether the treatment is administered before or after patients are hospitalized, most gains come from a dollar value placed on reduced mortality, although reduced hospitalization costs still account for over $10 billion in savings in either treatment scenario. Gains from reduced mortality range from $46.1 billion to $77.1 billion for a treatment administered to nonhospitalized patients that reduces the risk of hospitalization, and from $55.3 billion to $92.5 billion for a treatment that reduces mortality and length of stay for hospitalized patients.
Although large, the estimated health benefits exclude an important element of value from an effective treatment for C-19 if it hastens an economic recovery.[iii] In May 2020, the Congressional Budget Office (CBO) released a revised set of interim economic projections for 2020 and 202117 that accounted for the economic impact of the pandemic and related mitigation policies. The May projections were substantially lower than those from January,18 which did not account for the impact of C-19 on the U.S. economy. On June 1, 2020, the CBO projected that the cumulative real output (in 2019 dollars) over 10 years would be $7.9 trillion, or 3.0% of cumulative real GDP, less than what it had projected in January.[8]
If an effective treatment had been available at the beginning of the pandemic, it is possible that strict mitigation policies like lockdowns — which aimed to slow C-19 transmission and manage the flow of cases requiring hospitalization to avoid overwhelming the healthcare system — would have been unnecessary. While most states have already relaxed or lifted restrictions,[19] hospital capacity remains a concern as cases continue to rise in some states,[20] and mitigation is being reimposed in certain areas.[21] If a treatment reduces hospitalizations or shortens hospital stays, it would effectively expand existing hospital capacity. As a result, states could potentially manage the C-19 pandemic with less strict mitigation policies, resulting in smaller negative impact on economic activity.
Even as states continue to loosen restrictions on economic activity and some resume their usual activities, others may be reluctant to return to their “normal” behavior, which would contribute to a sluggish economic recovery. Several recent surveys suggest that a large segment of the population (65– 80%) is uncomfortable engaging in activities such as eating out or going to the mall.[22,23] In addition to boosting hospital capacity, an effective treatment could also increase people’s willingness to return to more normal levels of economic activity. Moreover, a treatment could provide a psychological benefit to workers: Approximately 45% report an effective treatment would make them feel safe in returning to work.[23] Determining the exact size of the economic benefit from treatment would require a model incorporating the interactions between treatment, social mitigation policies and consumer behavior. However, given the $7.9 trillion impact C-19 has had on the U.S. economy, the combined effects that a treatment could have on easing social mitigation policies and boosting citizens’ confidence in engaging in economic activities could easily be as large or larger than the health impacts we model. For example, if a treatment could offset the economic losses by even 5% (or almost $400 billion), the economic benefit from treatment would be nearly four to seven times larger than the health benefits we model.
The federal Biomedical Advanced Research and Development Authority has committed $359 million to developing treatments for C-19, compared to more than $2.2 billion to manufacture vaccines that are not yet proven safe or effective.[24] While developing a vaccine is undoubtedly a high priority, international efforts to develop and manufacture a vaccine that can meet worldwide demand quickly have generated expectations that may be hard to meet. Even after a vaccine for C-19 is widely available, people will continue to contract the virus because some will not get vaccinated, and the vaccine may not be effective in all cases, particularly among older populations at the highest risk for serious disease and mortality.[iv] For example, the annual flu vaccine reduces the risk of flu illness by only 40–60%, even in years when the vaccine is well matched to the circulating virus strain.[27] As such, an effective treatment for C-19 should be part of our public health strategy to help manage this and future pandemics. Efforts to develop effective treatments should be prioritized alongside vaccine development, since treatments for both mild and severe disease will continue to generate value even after a vaccine is developed.
One important limitation of our work involves the significant uncertainty surrounding the parameter values used to describe the behavior of the virus. We rely on respected sources such as the CDC for our parameter values, but given the rapidly evolving nature of the data and scientists’ understanding of this virus, parameter estimates can vary widely across sources and change substantially as the pandemic progresses.[v] The magnitudes of our estimated effects depend particularly on the mortality rate of the virus, and sources differ widely on its true value. For this reason, we explore multiple parameter values and present our main results using different but plausible alternatives for mortality rates. Other important parameters are subject to similar uncertainty, including prevalence of asymptomatic infection and the disease attack rate. In our main analysis, we assume a Q1–Q2 attack rate of 5%, the lower bound of CDC seroprevalence estimates of 5–8% by late June,[4] and that 20% of the population will be infected by the end of 2021. We deliberately chose conservative values here but explore the impact of alternative parameter values for six- and 24-month attack rates in sensitivity analyses in an online appendix.
A second limitation is that we use a stylized, static model to estimate results. For example, disease mortality is limited to hospitalized patients only, and treatments are assumed to be widely available as of July 2020. Our model also does not capture transmission dynamics and their relationship to possible mitigation policies. Recently, new cases in the U.S. have been increasing, while the number of deaths is falling, suggesting shifting infection toward younger populations or improved treatment as providers learn more about how to treat the virus, or both. Indeed, the precise relationships between disease transmission, mitigation policies, hospital capacity and economic activity pose an interesting question for future research, but go beyond the scope of the current study.
Given these limitations, the precision of our estimated effects should not be over-emphasized. Nevertheless, they suggest that a treatment could deliver significant value and should inform the urgency with which treatments are pursued. Our results also demonstrate what an important role mortality effects play in the overall value of a treatment, and that even if the health impact of such a treatment is very large, it may account for a relatively modest share of the total value of a treatment when potential economic effects are included. In fact, with the U.S. not pursuing a strategy of “crushing the virus” like Europe and Asia,[30] a treatment to manage the virus’s impact becomes even more valuable.
Footnotes
- All cases that are not hospitalized recover (i.e. mortality is limited to hospitalized patients).
- While more than 160 C-19 vaccines were in development as of mid-June 2020, only two had begun Phase III trials,10 and an effective vaccine is unlikely to be widely available until 2021 or later.[11]
- A treatment may also create value if it reduces the indirect costs that result when healthcare is delayed or foregone. With the advent of C-19, U.S. healthcare utilization dropped abruptly in categories such as dental visits, inpatient and outpatient services, physician services and cancer screenings. If postponing or forgoing these services causes adverse health outcomes, then a treatment that ameliorates these care delays could reduce these indirect healthcare costs.
- Aging is associated with immunosenescence, a weakening of the immune system, which renders older populations more susceptible to infection, cancer, autoimmune disease and vaccine failure.[25,26]
- For example, Bartsch et al. (2020) used a model similar to ours and predicted 10.8 million to 11.5 million C-19 hospitalizations assuming a 20% attack rate and CDC hospitalization data from February to March 2020.28 This prediction seems high given 245,000 reported hospitalizations in 38 states in the first six months of the pandemic.[29] In comparison, our no-treatment scenario predicts 1.5 million hospitalizations, or roughly six times the current number of hospitalizations.
References
- Centers for Disease Control and Prevention. Cases in the U.S. 2020 [cited 2020 Jun 26]. Available from: https://www.cdc.gov/ coronavirus/2019-ncov/cases-updates/cases-in-us.html
- Dasta JF, McLaughlin TP, Mody SH, Piech CT. Daily cost of an intensive care unit day: the contribution of mechanical ventilation. Crit Care Med. 2005 Jun; 33(6):1266-71.
- Randolph HE, Barreiro LB. Herd immunity: understanding COVID-19. Immunity. 2020 May 19; 52(5):737-41.
- Sun LH, Achenbach J. CDC chief says coronavirus cases may be 10 times higher than reported. Washington Post. 2020 June 25. Available from: https://www.washingtonpost.com/ health/2020/06/25/coronavirus-cases-10-times-larger
- Milken Institute. COVID-19 treatment and vaccine tracker. [cited 2020 Jun 14]. Available from: https://milken-institute-covid-19-tracker.webflow.io/#vaccines_intro
- Beigel JH, Tomashek KM, Dodd LE, Mehta AK, Zingman BS, Kalil AC et al. Remdesivir for the treatment of Covid-19 — preliminary report. N Engl J Med. 2020 May 22.
- University of Oxford. Low-cost dexamethasone reduces death by up to one third in hospitalised patients with severe respiratory complications of COVID-19. Oxford University News Release. 2020 Jun 16. Available from: https://www.recoverytrial.net/files/recovery_dexamethasone_ statement_160620_v2final.pdf
- Congressional Budget Office. Letter to Charles E. Schumer re: comparison of CBO’s May 2020 interim projections of gross domestic product and its January 2020 baseline projections. 2020 Jun 1. Available from: https://www.cbo.gov/system/files/2020- 06/56376-GDP.pdf
- Centers for Disease Control and Prevention and Office of the Assistant Secretary for Preparedness and Response. COVID-19 pandemic planning scenarios. 2020 May 20. [cited 2020 Jun 12]. Available from: https://www.cdc.gov/coronavirus/2019-ncov/hcp/ planning-scenarios.html
- Corum J, Grady D, Wee S, Zimmer C. Coronavirus vaccine tracker. New York Times. [cited 2020 Jun 30]. https://www. nytimes.com/interactive/2020/science/coronavirus-vaccine-tracker.html
- Neergaard L, Fingerhut H. AP-NORC poll: Half of Americans would get a COVID-19 vaccine. AP News. 2020 May 27. Available from: https://apnews.com/ dacdc8bc428dd4df6511bfa259cfec44
- Eastman RT, Roth JS, Brimacombe KR, Simeonov A, Shen M, Patnaik S, Hall MD. Remdesivir: a review of its discovery and development leading to emergency use authorization for treatment of COVID-19. ACS Cent Sci. 2020 May 27; 6(5):672-83.
- Gilead Sciences. Working to supply remdesivir for COVID- 19. [cited 2020 May 27]. Available from: https://www. gilead.com/purpose/advancing-global-health/covid-19/ working-to-supply-remdesivir-for-covid-19
- World Health Organization. News release: WHO welcomes preliminary results about dexamethasone use in treating critically ill COVID-19 patients. 2020 16 Jun. Available from: https://www.who.int/news-room/ detail/16-06-2020-who-welcomes-preliminary-results-about-dexamethasone-use-in-treating-critically-ill-covid-19-patients
- Wu KJ. Gilead to test a version of remdesivir that can be inhaled. New York Times. 2020 Jun 22. Available from: https://www. nytimes.com/2020/06/22/health/gilead-remdesivir-coronavirus-nebulizer.html
- Institute for Health Metrics and Evaluation. COVID-19: What’s new for June 15, 2020. [cited 2020 Jun 17]. Available from: http://www.healthdata.org/covid/updates
- Congressional Budget Office. Interim economic projections for 2020 and 2021. 2020 May [cited 2020 Jun 12]. Available from: https://www.cbo.gov/publication/56368
- Congressional Budget Office. The budget and economic outlook: 2020 to 2030. 2020 Jan 28 [cited 2020 Jun 12]. Available from: https://www.cbo.gov/publication/56020
- USA Today. Coronavirus reopening: map of COVID-19 case trends, reopening status and mobility. USA Today. [cited 2020 Jun 29]. Available from: https://www.usatoday.com/storytelling/ coronavirus-reopening-america-map
- Wolfe J, Takenaga L. Coronavirus briefing: what happened today. New York Times. [cited 2020 Jun 29]. Available from: https:// www.nytimes.com/2020/06/25/us/coronavirus-florida-texas-california-arizona.html
- Weber PJ, Smith MR. U.S. states reimpose virus controls after daily cases surged to all-time high. CTV News. 2020 Jun 27. Available from: https://www.ctvnews.ca/health/ coronavirus/u-s-states-reimpose-virus-controls-after-daily-cases-surged-to-all-time-high-1.5002610
- Qualtrics. Return to work/back to business study. 2020 Apr 30. Available from: https://success.qualtrics.com/rs/542-FMF-412/ images/Return_to_Work_and_Back_to_Business.pdf
- Meyers A. When will consumers feel safe again? Morning Consult. [cited 2020 Jun 16]. Available from: https:// morningconsult.com/2020/06/29/tracking-consumer-comfort-with-dining-out-and-other-leisure-activities/
- Thomas K. Coronavirus attacks the lungs: a federal agency just halted funding for new lung treatments. New York Times. 2020 Jun 19. Available from: https://www.nytimes.com/2020/06/19/ health/coronavirus-lung-treatment-funding.html
- Grubeck-Loebenstein B, Della Bella S, Iorio AM, Michel J, Pawelec G, Solana R. Immunosenescence and vaccine failure in the elderly. Aging Clin Exp Res. 2009 Jun; 21(3):201-9.
- Targonski PV, Jacobson RM, Poland GA. Immunosenescence: role and measurement in influenza vaccine response among the elderly. Vaccine. 2007 Apr 20; 25(16):3066-69.
- Centers for Disease Control and Prevention. Vaccine effectiveness: how well do the flu vaccines work? 2020 Jan 3 [cited 2020 Jun 29]. Available from: https://www.cdc.gov/flu/ vaccines-work/vaccineeffect.htm
- Bartsch SM, Ferguson MC, McKinnell JA, O’Shea KJ, Wedlock PT, Siegmund SS et al. The potential health care costs and resource use associated with COVID-19 in the United States: a simulation estimate of the direct medical costs and health care resource use associated with COVID-19 infections in the United States. Health Aff. 2020 Apr 23; 39(6):927-35.
- University of Minnesota Carlson School of Management. COVID-19 hospitalization tracking project. 2020 Apr 6 [cited 2020 Jun 29]. Available from: https://carlsonschool.umn.edu/ mili-misrc-covid19-tracking-project
- Gottlieb S, McClellan M. Rules for clinical trials in a pandemic. Wall Street Journal. 2020 Jun 21. Available from: https://www.wsj.com/articles/ rules-for-clinical-trials-in-a-pandemic-11592770800
- Fiedler M, Song Z. Estimating potential spending on COVID- 19 care. USC-Brookings Schaeffer Initiative for Health Policy. 2020 May 7. Available from: https://www.brookings.edu/ research/estimating-potential-spending-on-covid-19-care
- Briggs A. Moving beyond ‘lives-saved’ from COVID-19. Avalon Heath Economics. 2020 May 15. Available from: https:// avalonecon.com/moving-beyond-lives-saved-from-covid-19
You must be logged in to post a comment.