Key Takeaways
- Valvular heart disease accounts for a substantial burden of illness, especially in the elderly population.
- Transcatheter aortic valve replacement (TAVR) has facilitated treatment of valvular heart disease in patient’s ineligible or reluctant to undergo open-heart surgery. While rates of TAVR have increased over time, uptake of the procedure remains low.
- TAVR will generate cumulative social value of about $115 billion between 2011 and 2040 for patients who were medically managed.
- Given the high social value, efforts to broaden the patient pool and address unmet need should be prioritized.
Abstract
Aortic stenosis accounts for a substantial burden of illness in the elderly population. The development of transcatheter aortic valve replacement (TAVR) over the past decade has facilitated treatment of aortic stenosis in patients otherwise ineligible for corrective surgery or who are reluctant to undergo open-heart surgery. We estimate the social value of past and future TAVR procedures by conducting a microsimulation study of symptomatic aortic stenosis using the Future Elderly Model (FEM) and samples from the traditional Medicare fee-for-service population. To estimate mortality benefits, we use data from a clinical trial that compared TAVR to medical management for patients who were ineligible for surgical valve replacement as the “high-risk” mortality assumption. We also assume that aortic stenosis patients experience average mortality risk while untreated and after TAVR, which we refer to as the “average-risk” mortality assumption. Under both mortality risk assumptions, we find that TAVR has positive social value for all disease, disability and age groups when each additional year of life is valued at $150,000, except when performed in patients with lung disease or more than one difficulty in activities of daily living. We also find that each percentage point of TAVR expansion generates $142.33 million and $61.50 million in additional social value under the high-risk and average-risk assumptions, respectively.
Introduction
While less well recognized than other cardiovascular diseases, valvular heart disease accounts for a substantial burden of illness, especially in the elderly population. While the overall prevalence of all valvular diseases in the U.S. population has been estimated at around 2.5%, the prevalence in the cohort age 75 and older is as high as 13.3%.[1] With a population prevalence of around 12.4%, aortic stenosis (AS) is by far the most common valvular heart disease, and around 3.4% of people over 75 suffer from severe AS.[2] Symptomatic AS is predominantly an age-related condition. Median age at diagnosis tends to be around 74 for men and 79 for women, and prevalence rises rapidly after age 65. [3,4]
AS leads to a gradual obstruction of the outflow of blood from the heart’s left ventricle to the body. In mild cases, the heart can compensate for the obstruction by pumping harder and maintaining adequate blood flow. As stenosis progresses, the left ventricle’s ability to overcome the obstruction is limited, leading to increasing left ventricular pressures that contribute to congestive symptoms and poor cardiac output with clinical symptoms that may include shortness of breath, syncope or angina.
Current guidelines recommend valve replacement in cases of symptomatic AS and asymptomatic AS in the setting of depressed left ventricular function or in the presence of an aortic velocity greater than five meters per second.5 Treatment for AS requires valve replacement. Traditionally, open-heart surgery or surgical aortic valve replacement (SAVR) was required. Over the last decade, transcatheter aortic valve replacement (TAVR), a minimally invasive approach to replace the aortic valve via a catheter-based procedure, has emerged as a treatment option. TAVR uses a balloon-mounted expandable valve that crushes the severely diseased and calcified native aortic valve. The original randomized trials recruited patients who were not suitable candidates for surgery secondary to their high operative risk or anatomical considerations.[6,7] Iterative trials expanded the indication for treatment with the recruitment of patients with intermediate and low surgical risk.[8,9]
While the emergence of TAVR made valve replacement possible for a greater range of patients, unmet need remains high. For example, Malaisrie et al. recently estimated that while the rate of unoperated AS declined by approximately 10 percentage points after arrival of TAVR, over half of patients continue to be medically managed.[10] These findings are of concern as the prognosis of unoperated severe and symptomatic stenosis is poor: Malaisrie et al. reported an adjusted mortality risk reduction of 62% in patients who underwent valve replacement.10 Similarly, Chao et al. reported a median survival of 2.2 years for patients with severe AS who were medically managed as compared to 6.6 years for patients who received TAVR.[11] Even in asymptomatic patients with severe stenosis, mortality risk is 3.5 times higher if patients are medically managed.[12]
Medically managed patients tend to be older and have more severely impaired cardiac function, but operative risk is commonly overestimated and symptoms downplayed, leading to guideline-inconsistent treatment decisions.[13,14]
We wish to understand the social value of TAVR introduction and uptake. Social value is the willingness to pay for a health intervention, summed up across all stakeholders.cf.[15] This requires a model-based approach, since we are interested in hypothetical growth in the uptake of TAVR. We use the Future Elderly Model (FEM), a microsimulation of the U.S. population age 51 and older. The FEM simulates how individuals acquire disease and disability and ultimately die.[16] It accounts for competing risks, medical costs and a variety of economic outcomes.
Under two different mortality assumptions, we find that the introduction of TAVR has positive social value for all disease, disability and age groups when each additional year of life is valued at $150,000, except for patients with lung disease or more than one difficulty in activities of daily living (ADL). The paper is organized as follows: Section 2 presents our methods, section 3 features our results, and section 4 concludes with discussion of the results and some limitations of the analysis.
2. Methods
2.1 Overview of Methods
We measure the social value of TAVR introduction from a cohort and a population perspective. First, we forecast outcomes for the cohort of patients age 65+ who underwent TAVR in 2019 or 2020. Next, we forecast outcomes for the population of patients age 65+ who underwent TAVR at any time from 2011 (its U.S. introduction date) until 2040. Both of these analyses simulate patients’ post-TAVR life course using the FEM, which uses disease, disability and mortality transition models estimated from individual longitudinal trajectories in the Health and Retirement Study (HRS) data.17,18 Individual medical costs are estimated using the 2007–2012 Medicare Current Beneficiary Survey’s Cost and Use data.19–22 Goldman et al. provide a detailed description of FEM.23
Briefly, FEM simulates a broad set of health risk factors, chronic conditions, functional limitations and mortality. The simulations include predictive models for body mass index, smoking, chronic disease incidence, development of functional limitations, use of some pharmaceuticals and mortality. The HRS is biennial, so FEM simulations use a two-year time step.
Since the HRS does not include data on AS or valve-replacement procedures, we use traditional Medicare (TM) fee-for-service patient data to develop FEM transition models of the disease and treatment. This is described in section 2.2. Section 2.3 describes our calibration and assumptions regarding TAVR and SAVR rates. With this model of disease and procedure trends in hand, we also assume mortality effects of AS and TAVR costs as described in sections 2.4 and 2.5. Putting all these pieces together, we simulate the status quo dissemination and uptake of TAVR and compare this to a counterfactual scenario in which TAVR was never introduced. Section 2.6 describes these scenarios in more detail and how we analyze them to estimate the benefits of TAVR introduction.
2.2 Baseline Models
In order to model trends in TAVR uptake, we begin with baseline models that capture disease progression and procedure uptake around the time that TAVR was introduced. Later, we apply trends to the model in order to capture the changes in patient-risk profiles over time after TAVR was introduced. Patients can be in one of four AS-related states in FEM: asymptomatic or no AS, untreated symptomatic AS, SAVR and TAVR. Figure 1 illustrates the states and allowed transitions between states. We estimate the transition models using 100% of the TM patient data and obtained claims and enrollment data for the years 2010–2013. The estimation sample is restricted to individuals age 65 or older in 2010, who survived with continuous TM enrollment through 2013. The states are defined within the estimation sample as follows:
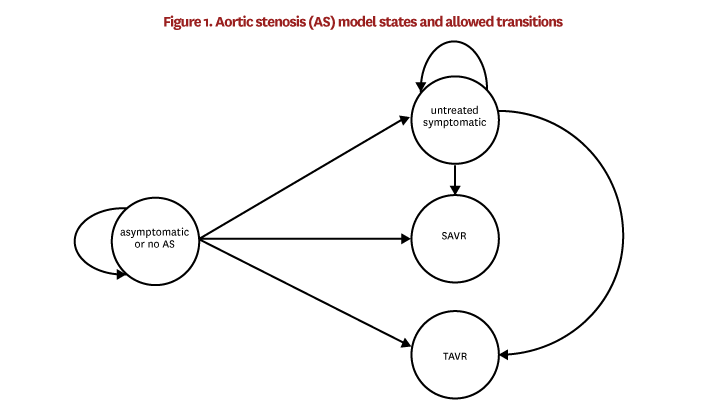
Patients are in the asymptomatic or no AS state because they have no stenosis, their stenosis has yet to be diagnosed or their stenosis has been diagnosed but remains asymptomatic. We combine these groups because claims data cannot reliably distinguish patients without stenosis from undiagnosed stenosis patients. Additionally, although we can identify diagnosed but asymptomatic patients, this subset is not likely to be representative of the overall group of patients with asymptomatic AS, since factors like access to care might influence the probability of getting diagnoses. Therefore, in the TM patient data, the asymptomatic or no AS state includes (1) all patients who had a valvular disease diagnosisI in 2010–2013 and no symptomsII in 2010–2013, and (2) all patients who did not have a valvular disease diagnosis at all. It also excludes patients who received SAVR or TAVRIII in 2010–2013.
Untreated symptomatic patients are patients in this sample who did not receive SAVR or TAVR in 2010–2013, had an aortic valvular disease diagnosis in 2010–2013, had no AS symptoms in 2010 or 2011, and had AS symptoms in 2012 or 2013.
SAVR and TAVR patients are those who received the procedure in 2012 or 2013.
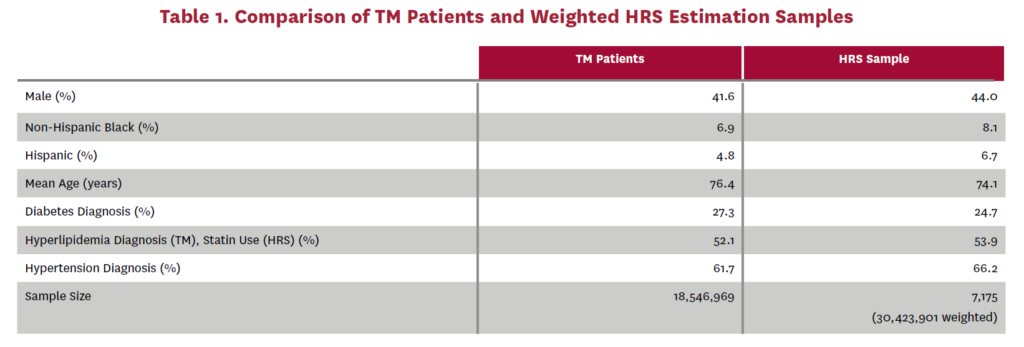
Using these patient groups, we estimate one transition model estimating the probabilities that an asymptomatic or no AS patient transitions to (1) untreated symptomatic, (2) SAVR or (3) TAVR, and a second transition model estimating the probabilities that an untreated symptomatic patient transitions to (1) SAVR or (2) TAVR. We use a multinomial logit specification for both of these transition models. The independent variables are the same in both models: sex, age, race/ethnicityIV, and indicators for diabetes, hyperlipidemiaV and hypertension diagnosesVI in 2011. The model estimates are shown in tables 10 and 11. Harmonized versions of the predictor variables are also available in the HRS data and are simulated in FEM. Table 1 compares these predictor variables across the TM patient data and the corresponding weighted HRS dataVII that would have been used in our estimation had AS data been available in the HRS.
The transition models just described are incidence models for individuals age 65 and older. The first year of FEM simulation includes individuals age 65 and older for whom we do not know their previous AS state. Additionally, as FEM proceeds into the future, individuals enter the simulation as soon as they pass their 65th birthday. For these reasons, we also estimate a prevalence model that initializes the AS state of new Medicare entrants with no prior AS history data. Like the incidence models, the prevalence model uses 2010–2013 Medicare data restricted to individuals age 65 and older in 2010 with survival and continuous TM enrollment through 2013. The prevalence model predicts whether an individual is in the untreated symptomatic state. Prevalent cases are those who were diagnosed with valvular disease followed by AS symptoms within 2010–2013 and did not receive SAVR in 2010–2013. We use a binary logit specification. The independent variables are the same as in the incidence models: sex, age, race/ethnicity, and indicators for diabetes, hyperlipidemia and hypertension diagnoses in 2011. The prevalence-model estimates are shown in table 12.
In all of the above incidence and prevalence models, we identify patients with aortic valve disease diagnoses, regardless of concurrent disease of other valves and coronary artery disease. Ideally, we would identify patients who have been diagnosed with severe AS, specifically. This is not possible because TM claims data use ICD-9 diagnosis codes during the years of our baseline estimation and, unlike ICD-10 codes, ICD-9 codes do not distinguish AS from regurgitation. Furthermore, given that a code is present, neither ICD-9 nor ICD-10 codes convey information on the severity of the valve disease. Among the valvular disease patients who have symptoms suggestive of AS, about 19% are expected to result from isolated aortic regurgitation.[24,1] We account for this when using the prevalence model by reassigning 19% of the untreated symptomatic cases to be caused by isolated regurgitation. No adjustment is made when using the incidence models because TAVR is the end point of interest in our analysis and TAVR is not an approved treatment for isolated regurgitation. In effect, we are simulating the combined event of having stenosis and
being treated with TAVR given that the patient has a valvular disease diagnosis and symptoms of stenosis.
These baseline prevalence and incidence models are applied in FEM as follows. During the initial time step, the prevalence model is applied to all individuals age 65 and older to simulate whether they are in the untreated symptomatic state. Then, a randomly selected 19% of these untreated symptomatic cases are reassigned to regurgitation. Regurgitation patients are no longer able to develop symptomatic stenosis in the simulation. In each FEM time step after the first, the prevalence model is applied in the same way, but only to individuals who turned 65 during the time step, and 19% of the prevalent cases are reassigned to regurgitation. Next, one of the two incidence models is applied to all individuals over age 65 depending on whether they are in the asymptomatic or no AS state or the untreated symptomatic state. The incidence model computes the probability of transitioning into each of the four states [VIII] shown in figure 1, described at the beginning of this section. After these baseline probabilities are calculated, we adjust the SAVR and TAVR probabilities to account for time trends and observed procedure counts. These adjustments are described in the next section. Finally, FEM simulates the transition into a new state according to these adjusted probabilities.
2.3 Assumptions About TAVR and SAVR Rates
We project growth in age-specific procedure rates based on historical growth observed in TM patient data (see appendix A.2). However, we find that TM patient data undercount procedure rates compared to rates reported in the Transcatheter Valve Therapy Registry.25 This could be due, for example, to the absence of Medicare Advantage patients from the TM patient data. Therefore, as described in appendix A.3, we calibrate the TM-based models in FEM to known U.S. procedure counts in the registry. In order to project long-range TAVR and SAVR trends after 2020, we take advantage of the fact that TAVR was approved in the European Union in 2007. Germany allowed for rapid uptake while other countries initially limited procedure volumes, making Germany’s TAVR rates a valid predictor for uptake rates in the U.S.[26] We therefore use uptake trends reported in the German TAVR registry to predict U.S. trend growth (appendix A.4). We implement these trends as multipliers of the baseline SAVR and TAVR incidence probabilities. The multipliers are shown in figures 3–7.
2.4 Morality Effects of Untreated AS
Untreated symptomatic AS increases mortality risk and, conversely, valve replacement reduces this excess mortality risk. To quantify this effect, we want to know the difference in mortality risk between treated and untreated patients across surgical risk groups. However, we were only able to identify such data for inoperable patients because the availability of SAVR-precluded trials that randomized SAVR-eligible patients into no treatment. Deprived of a perfect way to estimate mortality benefit, we instead consider two alternative mortality assumptions based on different studies in the literature.
Our first assumption set leverages available evidence on the highest surgical risk (inoperable) patients. We use data from a clinical trial that compared TAVR to medical management in those patients. Makkar et al. reported a two-year mortality rate of 68% for medically managed patients that were ineligible to undergo SAVR because of high operative risk or anatomic reasons.7 Using TM patient data, we find a 10.9% mortality rate in 2012–2013 among people in the asymptomatic or no AS state. This yields a two-year mortality hazard ratio of 6.2 for untreated symptomatic versus asymptomatic or no AS patients.
We assume that this excess mortality risk from not treating severe symptomatic AS (and hence the benefit of treatment) for the inoperable patients applies to all lower surgical risk groups. We also assume that treating these patients with TAVR removes the stenosis-specific mortality risk. On the one hand, this assumption might understate benefit if lower-risk patients derive greater benefit from treatment than the sicker inoperable patients. On the other hand, if TAVR does not completely eliminate stenosis-specific mortality risk, it overstates benefit. We refer to this as the “high-risk” mortality assumption.
In our second assumption set, untreated symptomatic patients experience the average mortality risk reported in Makkar et al., Malaisrie et al., Chao et al., Brown et al. and Varadarajan et al. [7, 10, 11, 12, 27] This gives a two-year mortality hazard ratio of approximately 5.0 relative to TM patients in the asymptomatic or no AS state. For patients treated with TAVR, we assume the average mortality risk of Malaisrie et al., Chao et al., Brown et al. and Varadarajan et al. [10, 11, 12, 27] This gives a two-year hazard ratio of 1.5 relative to the asymptomatic or no AS state. Unlike the previous assumption set, TAVR does not completely remove the stenosis-specific risk here. We refer to this as the “average-risk” mortality assumption.
FEM computes the mortality probability for each individual in each time step and simulates whether or not they die during the time step. This probability is a function of demographic characteristics, risk factors, chronic conditions and functional limitations. We multiply mortality probabilities by the excess mortality risk factors for individuals in the untreated symptomatic state (6.2 under the high-risk assumption, 5.0 for the average-risk assumption) before simulating their mortality. Under the high-risk assumption, the mortality probability for individuals in the TAVR state is the default FEM probability, as if TAVR removed any specific mortality effects of symptomatic AS. However, post-TAVR mortality risk can still be elevated slightly relative to the pre-TAVR asymptomatic or no AS level because the mortality model accounts for risk from a heart disease diagnosis of any kind. A patient who had no other type of heart disease diagnosis before symptomatic AS would experience this elevated risk after TAVR under the high-risk assumption. Under the average-risk assumption, mortality for individuals in the TAVR state is elevated by a factor of 1.5.
In each set of mortality assumptions, we do not make any adjustments to mortality after SAVR because, as explained in section 2.6, patients who receive SAVR are not part of our analysis.
A sensitivity analysis of other mortality assumptions is provided in appendix A.8.
2.5 TAVR-Related Costs
We assume that patients receiving TAVR during a two-year FEM time step do so at the beginning of the time step. We assume that patients who die during a two-year time step do so in the middle of the time step, i.e., one year after the start of the time step. TAVR costs at the time of procedure have been estimated at $61,433, $54,256 and $69,592, while the follow-up costs in the first year have been estimated at $25,284, $26,861 and $28,766.28,29 Taking the average and deflating to 2010 dollars, we assign $77,504 for the average TAVR costs during the year of the procedure. This leads to a conservative estimate of benefits as procedure costs have decreased over time (see section 4 for discussion). We also assign $500 in follow-up costs for each subsequent year until death based on 2019 Medicare reimbursement rates.
We simulate the symptomatic AS population in two scenarios. The first scenario represents the status quo, in which TAVR was introduced and SAVR and TAVR procedure rates follow the trends described in section 2.3. The simulation steps applied to an individual in a given time step are illustrated in figure 8. In this status quo scenario, untreated symptomatic patients receive the mortality effects of section 2.4. Patients who receive TAVR have the mortality effects removed under the high-risk assumption or receive the post-TAVR mortality effect of section 2.4 under the average-risk assumption. Under either assumption set, patients who receive TAVR have the additional costs described in section 2.5.
The counterfactual scenario represents the world in which TAVR was never introduced. In each FEM time step, the baseline SAVR probability is inflated to match the baseline registry counts according to appendix A.3, but there are no adjustments for time trends after the baseline period. The baseline TAVR probability is also adjusted to match the baseline registry count and there is no adjustment for TAVR time trends. However, individuals in the TAVR state are treated the same as those in the untreated symptomatic state: Mortality risk is elevated with the multiplier for the untreated symptomatic state and there are no additional TAVR costs. Figure 9 shows the simulation steps applied to an individual in each time step of the counterfactual scenario.
We compare these two scenarios by selecting all individuals who received TAVR in the status quo scenario and removing any who received SAVR in the counterfactual scenario. This eliminates TAVR-for-SAVR substitutes and leaves us with the incremental cases who would not have their valve replaced if TAVR were not available.
We estimate the incremental effect of TAVR by subtracting the counterfactual outcomes from the status quo. We compute additional years of life by subtracting years lived in the counterfactual scenario from years lived in the status quo scenario. We compute additional medical costs in the same way. The additional medical costs include the TAVR costs described in section 2.5 and also the medical costs unrelated to TAVR in each additional year lived. We compute social value by assigning a dollar value to each additional year lived in the status quo scenario and subtracting from this the total additional medical costs. We report three separate social value estimates computed by valuing each additional life year at $100,000, $150,000 and $200,000 per year, respectively.
The age 65–69 group is unique in FEM because individuals who have just turned 65 are simulated with the prevalence model instead of an incidence model. Unlike the incidence models, the prevalence model does not allow direct transitions to SAVR or TAVR.
In effect, this forces new 65-year-olds to wait two years after diagnosis for TAVR, which exposes them to the elevated mortality risk of untreated symptomatic stenosis. Since it is clinically implausible that those patients would have to wait for their procedure, we limit our analyses to age 70 and older to avoid problems caused by censored data.Results
3. Results
We perform separate analyses of a single cohort receiving TAVR in 2019–2020 and the entire population receiving TAVR at any time up to 2040. We repeat each of these analyses under each of the two mortality assumption sets described in section 2.4. In each analysis, we report results for the entire group and then by previous disease diagnoses, disability and age group at the time of TAVR.IX Results for each analysis are reported in the aggregate and per capita. Finally, we estimate the social value generated by each percentage point increase in TAVR uptake. All medical costs are reported in 2010 dollars and we discount all dollar amounts to 2010 using a 3% annual rate because we report results from the perspective of TAVR’s introduction date in the U.S.
3.1 Cohort Receiving TAVR In 2019-2020
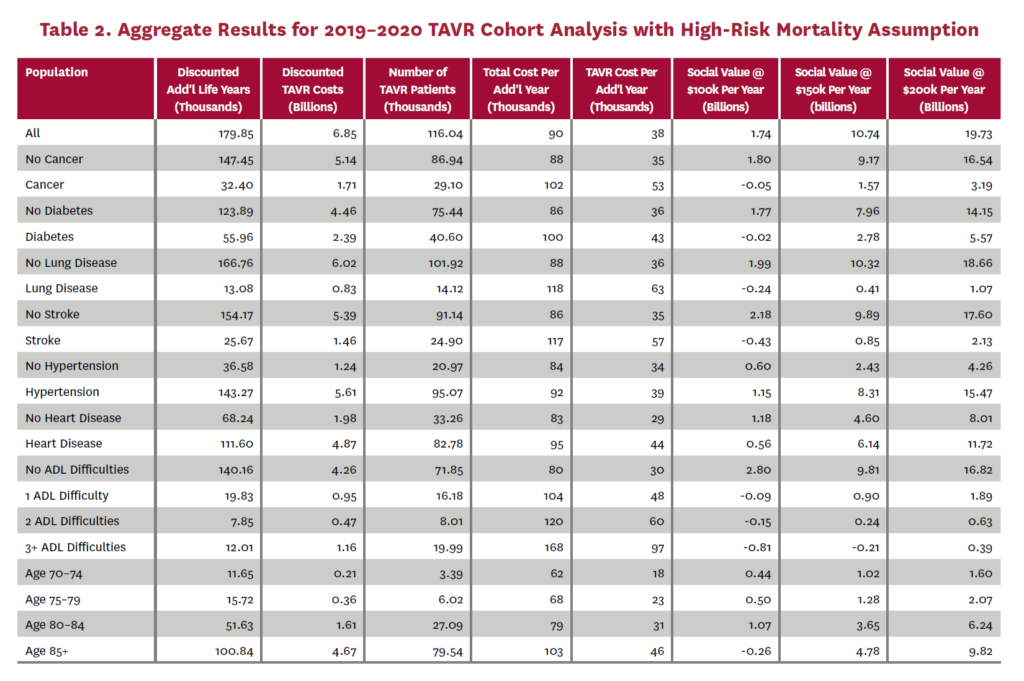
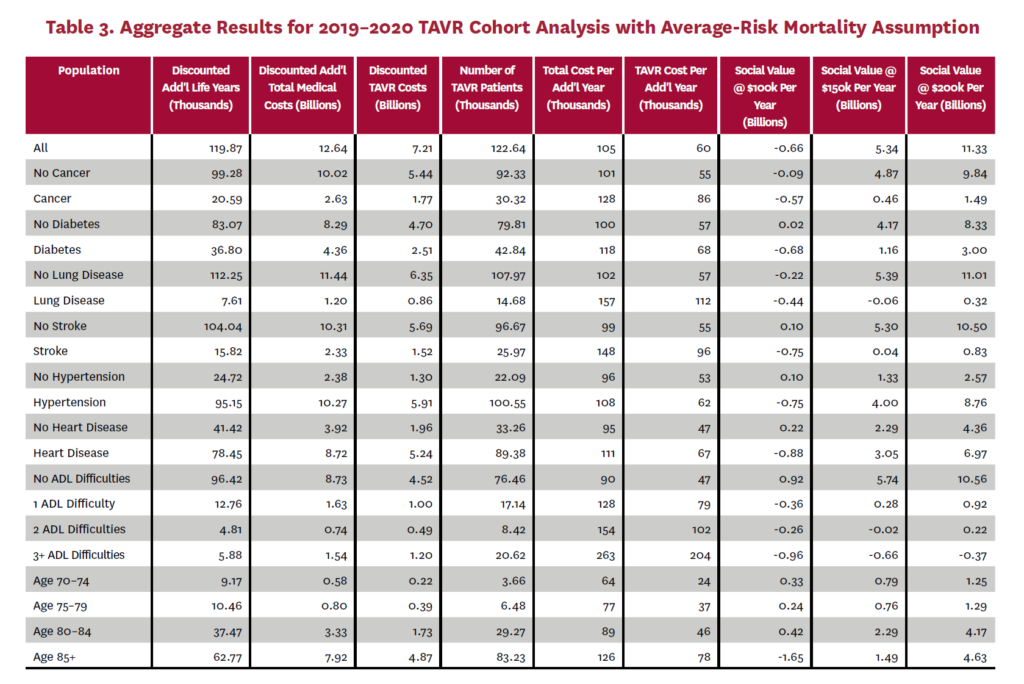
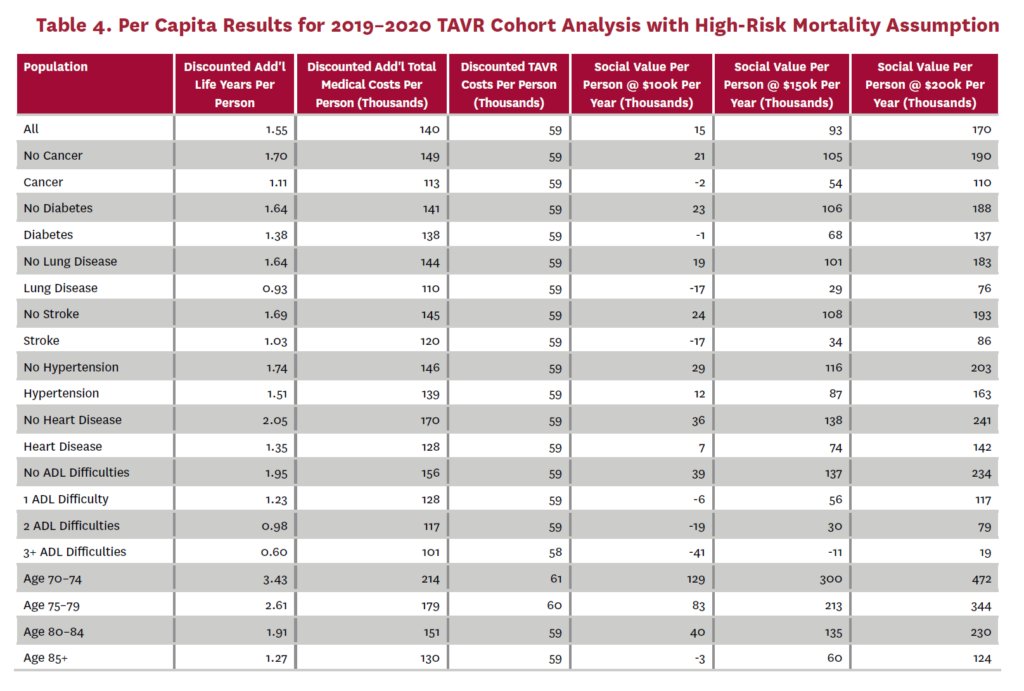
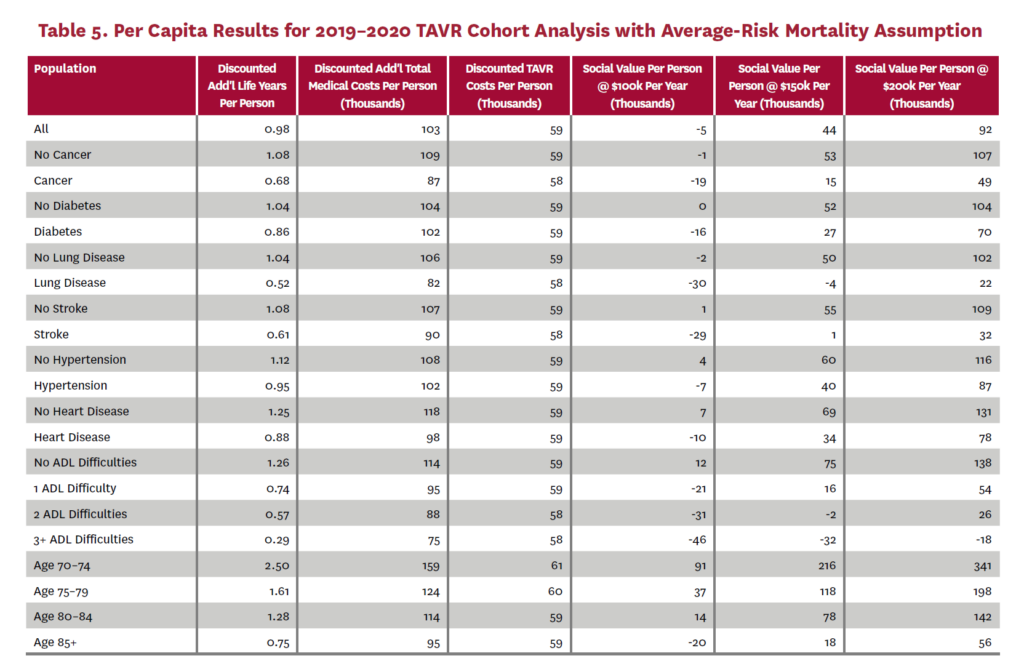
The cohort analysis examines patients who received TAVR in 2019–2020 in the status quo scenario and did not receive SAVR in 2019–2020 in the counterfactual scenario. Results are averaged over 1,000 Monte Carlo replications of FEM. Aggregate results for the high-risk and average-risk mortality assumptions are shown in tables 2 and 3, respectively. Under the high-risk mortality assumption, we estimate that the social value of TAVR is $10.74 billion in 2019–2020 when valuing each additional life year at $150,000. We estimate this social value at $5.34 billion under average-risk mortality. Per capita results for the different mortality assumptions are shown in tables 4 and 5. Per capita social value is positive for all patient groups except under the high-risk mortality assumption for patients with three or more ADL limitations (-$10,608) and under the average-risk mortality assumption for lung disease patients (-$3,823), patients with two ADL limitations (-$2,358), and patients with three or more ADL limitations (-$32,098).
3.2 Population Receiving TAVR, 2011-2040
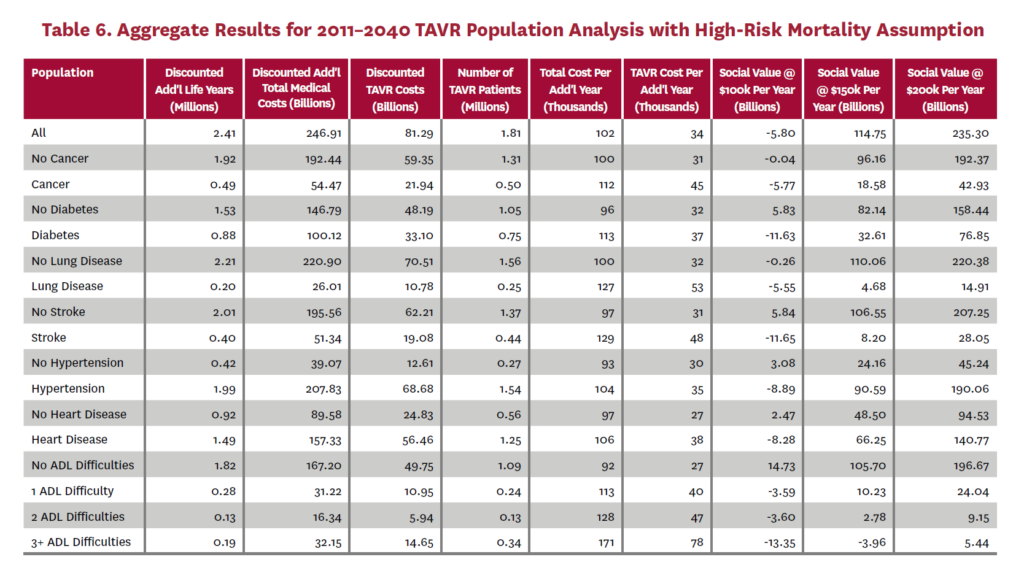
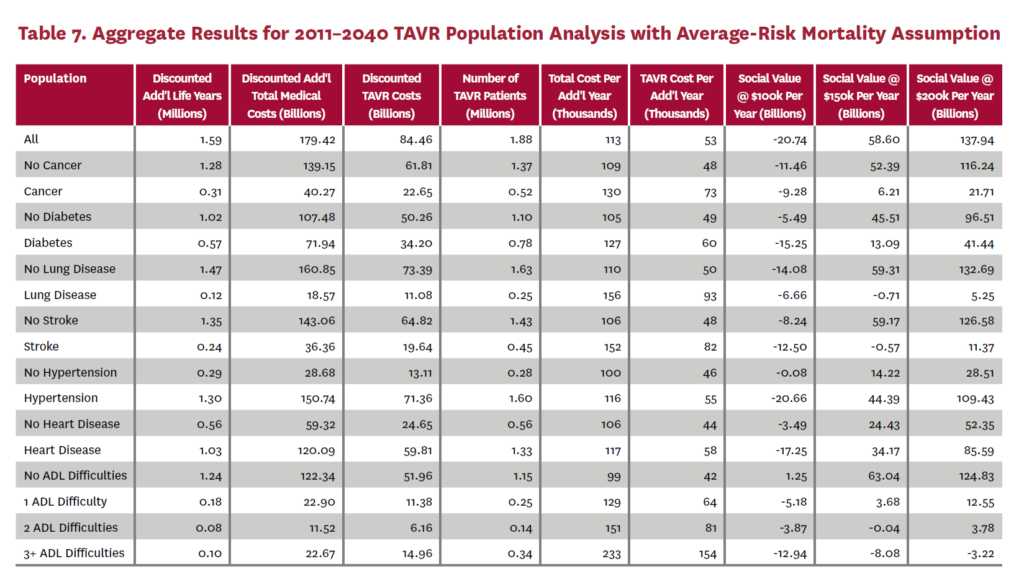
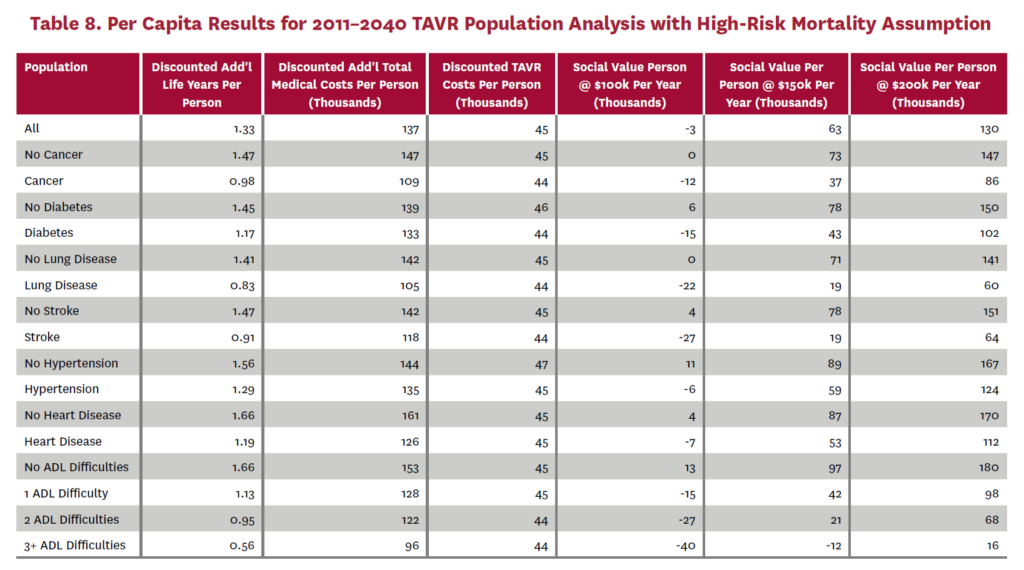
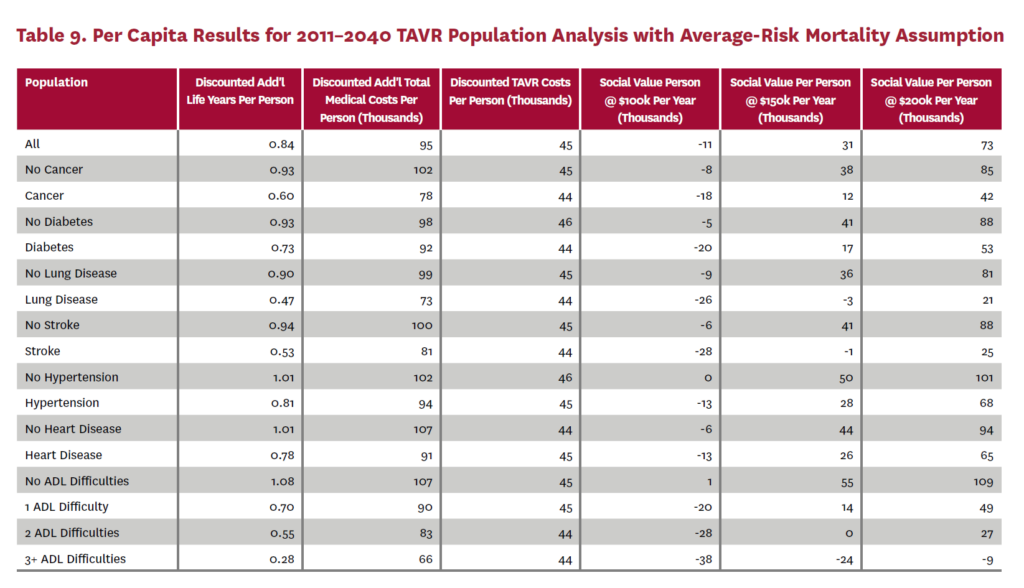
The population analysis looks at patients who received TAVR at any time from 2011 through 2040 in the status quo scenario and did not receive SAVR at any time during the counterfactual scenario. Results are averaged over 300 Monte Carlo replications of FEM.X Aggregate results for the high-risk and average-risk mortality assumptions are shown in tables 6 and 7, respectively. We estimate TAVR will generate $114.75 billion in social value through 2040 under the high-risk mortality assumption when valuing each additional life year at $150,000. We estimate $58.60 billion in social value under the average-risk mortality assumption. Per capita results for the different mortality assumptions are shown in tables 8 and 9. Per capita social value is positive for all patient groups except under the high-risk mortality assumption for patients with three or more ADL limitations (-$11,786) and under the average-risk mortality assumption for lung disease patients (-$2,780), stroke patients (-$1,259), patients with two ADL limitations (-$309), and patients with three or more ADL limitations (-$23,518).
3.3 Social Value of TAVR Expansion
In order to estimate the social value of TAVR expansion, we simulate the 2019–2020 cohort again, but with TAVR and SAVR multipliers at 2040 levels. Under the high-risk mortality assumption, this yields 132,311 TAVR patients (an increase of 14% from 116,040) and social value of $12.73 billion (an increase from $10.74 billion) when valuing additional years of life at $150,000. The first row of table 2 gives the number of TAVR patients and social value for the 2019–2020 cohort with 2020 SAVR and TAVR levels. Consequently, the increase in social value for each percentage point of TAVR expansion is $142.33 million with the high-risk mortality assumption.
Performing the same analysis under the average-risk mortality assumption, we find 134,937 TAVR patients (a 14% increase from 122,645) and social value of $5.95 billion (an increase from $5.34 billion). The first row of table 3 gives the number of TAVR patients and social value for the 2019–2020 cohort at 2020 TAVR levels with this mortality assumption. The increase in social value for each percentage point of TAVR expansion is $61.5 million under the average-risk mortality assumption.
4. Discussion
We conducted a simulation analysis of the social value generated from the introduction of TAVR as the alternative to SAVR for treatment of aortic valve disease. We find cumulative social value of $114.75 billion between 2011 and 2040 for the U.S. population under the high-risk mortality assumption and social value of $58.6 billion during the same time period under the average-risk mortality assumption. On a per-patient level, these values were on average $63,477 and $31,132, respectively, when valuing a life-year gained at $150,000. Importantly, net value is generated for all individuals except for those with lung disease or more than one ADL limitation (as described in section 3) before the TAVR procedure. In the population analysis using the average-risk mortality assumption, we also find negative social value for patients who had a stroke at any time before TAVR. However, this is not surprising as stroke patients often have ADL difficulties. The result of positive social value across groups of different ages and comorbidities is important, as our population reflects the real-world composition of the Medicare population, whereas clinical trials commonly select healthier patients.
Sussell et al. estimated $48 billion in cumulative social value of TAVR for inoperable patients between 2018 and 2028, with $38.5 billion (80%) accrued to patients while the rest was value to manufacturers.30 We estimate only value to patients as we consider only the cost of TAVR procedures. In terms of 2010 dollars, the Sussell et al. estimate equates to about $34 billion in value to patients over 10 years. This is consistent with our estimate of $115 billion over the 30 years from 2011 to 2040 using the high-risk mortality assumption. These estimates amount to $73,501 per patient in 2018–2028 versus $63,477 per patient in 2011–2040.
Chao et al. recently investigated the effect of TAVR introduction on survival using clinical data, and found that median survival time of patients with severe AS increased from 6.8 years to at least 11.5 years after the introduction of the technology.11 Similar to our findings, gains in life-years were larger in younger age cohorts. Those results complement earlier findings that TAVR is cost-effective compared to medical management in inoperable patients and to SAVR in high-risk patients.29,31,32 Moreover, TAVR was found to dominate SAVR in patients with intermediate operative risk, as it was projected to have lower cost and better outcomes. [28]
It needs to be kept in mind that most parameters of our simulation were based on results from the early TAVR era, which probably understate the value of the procedure under contemporary practice. We showed earlier that the risk-adjusted mortality 30 days post-TAVR has declined 78% from 2007 to 2016 and the routinization of the procedure has helped reduce complexity and resource use. [33, 34, 35]
Such findings are important contributions to the policy debate about TAVR, given the budget impact of a high-cost procedure for a condition with an estimated pooled prevalence of 3.4% in the elderly population.2 While TAVR rates have increased over time, the uptake of the procedure remains well below current recommendations and evidence, depriving patients of a safe and effective procedure. Durko et al. estimated an annual number of 51,998 patients with an indication for TAVR, excluding the recent indication for patients with low surgical risk, who account for about 50% of the patient pool, whereas only 39,473 procedures were conducted on average per year since the commercial introduction of TAVR. [36, 25] The annual number of procedures exceeded Durko et al.’s estimated need only in 2018 and our projections based on historic trends point to an average of around 62,000 cases per year until 2040. As with many medical services, disparities exist in the uptake of TAVR.37,38 Together, such estimates point to a substantial untreated pool of cases and opportunities to increase social value and address unequal access to care.
Several promising trends might help close this gap. Increased availability of TAVR has now lowered to 35 minutes the median driving time to a TAVR-capable facility, decreasing geographic obstacles to access.39 The latest American College of Cardiology/American Heart Association guidelines broadened the recommendation for TAVR and initiatives like “Valve for Life” in the U.K. raise awareness for unmet need.5,40 Such efforts could be broadened and intensified to address the unmet need in this high-risk patient population.
4.1 Limitations
Our analysis is limited because the ICD-9 diagnosis codes in TM claims data only allow us to classify patients as being diagnosed with aortic valve disease, not AS specifically. The ICD-10 scheme includes codes that identify AS. Unfortunately, ICD-10 was not introduced in the U.S. until late 2015. Had we used ICD-10 codes, we would have been unable to estimate trends in the years immediately after TAVR introduction and would not have enough data to estimate the two-year transition models required by FEM. As more recent years of TM data become available, it would be worthwhile to explore the sensitivity of our analyses to which ICD version is used. In addition, ICD codes do not reflect the severity of valve disease. We infer the presence of severe symptomatic AS from the new appearance of symptoms in a patient with a diagnosis of AS and acknowledge that we may have misclassified some patients.
FEM simulates events in two-year time steps, but it does not simulate exactly when events happen within the two years. Furthermore, the risk factors for events in the current two-year period are determined in the previous two-year period. For this reason, FEM cannot capture the short-term changes in mortality risk that are expected when a patient becomes symptomatic or immediately after the TAVR procedure.
It is possible that we underestimate the benefit of TAVR on life expectancy because we use an estimate for the hazard
ratio of mortality for medically managed patients from the study of the inoperable cohort.7 An extensive literature search failed to yield any estimates for patients with lower surgical risk, probably because SAVR was always an option for those patients. While the use of a hazard ratio accounts for differences in baseline mortality risk, it is possible that the incremental benefit would increase in lower-risk patients, implying that our estimate of life-years gained and, consequently, social value is conservative. Moreover, we are not able to quality adjust the gains in life-years; thus, we may overstate gains for older and sicker populations.
Our estimates of social value are based on procedure costs from the early years of TAVR adoption in the U.S. As evidence suggests that routinizing and streamlining the procedure has reduced resource use and cost, we might understate social value. [34, 35, 41]
Our analysis assumes that the Chronic Conditions Warehouse condition codes in Medicare claims data map directly to self-reported conditions in the HRS. For diabetes, St. Clair et al. show lower prevalence in self-reports when compared to claims.42 This could be due to memory errors in self-reports or due to the TM patient population tending to be less healthy than Medicare Advantage enrollees. Future work should consider the effects of sample bias and measurement error between the two data types.
References
- Nkomo VT, JM Gardin, TN Skelton et al. (2006). Burden of valvular heart diseases: A population-based study. Lancet, 368(9540): 1005-11.
- Osnabrugge RL, D Mylotte D, SJ Head et al. (2013). Aortic stenosis in the elderly: Disease prevalence and number of candidates for transcatheter aortic valve replacement: A meta-analysis and modeling study. Journal of the American College of Cardiology, 62(11): 1002-12.
- Martinsson A, X Li, C Andersson et al. (2015). Temporal trends in the incidence and prognosis of aortic stenosis. Circulation, 131(11): 988-94.
- Thaden JJ, VT Nkomo and M Enriquez-Sarano. (2014). The global burden of aortic stenosis. Progress in Cardiovascular Diseases, 56(6): 565-71.
- Otto CM, RA Nishimura, RO Bono et al. (2020). 2020 ACC/AHA guideline for the management of patients with valvular heart disease: A report of the American College of Cardiology/American Heart Association Joint Committee on Clinical Practice Guidelines. Circulation, 143(5): e72-227
- Rodés-Cabau J, IG Webb, A Cheung et al. (2010). Transcatheter aortic valve implantation for the treatment of severe symptomatic aortic stenosis in patients at very high or prohibitive surgical risk: Acute and late outcomes of the multicenter Canadian experience. Journal of the American College of Cardiology, 55(11): 1080-90.
- Makkar RR, GP Fontana, H Jilaihawi et al. (2012). Transcatheter aortic-valve replacement for inoperable severe aortic stenosis. New England Journal of Medicine, 366(18): 1696-1704.
- Elguindy A. (2016). PARTNER 2A & SAPIEN 3: TAVI for intermediate risk patients. Global Cardiology Science and Practice, 4.
- Mack MJ, MB Leon, VH Thourani et al. (2019). Transcatheter aortic-valve replacement with a balloon-expandable valve in low-risk patients. New England Journal of Medicine, 380(18): 1695-1705.
- Malaisrie SC, E Tuday, B Lapin et al. (2011). Transcatheter aortic valve implantation decreases the rate of unoperated aortic stenosis. European Journal of Cardio-thoracic Surgery, 40(1): 43-48.
- Chao A, MH Picard, JJ Passeri et al. (2021). Effect of availability of transcatheter aortic-valve implantation on survival for all patients with severe aortic stenosis. American Journal of Cardiology, 149: 72-77.
- Brown ML, PA Pellikka, HV Schaff et al. (2008). The benefits of early valve replacement in asymptomatic patients with severe aortic stenosis. Journal of Thoracic and Cardiovascular Surgery, 135(2): 308-15.
- Iung B, A Cachier, G Baron et al. (2005). Decision-making in elderly patients with severe aortic stenosis: Why are so many denied surgery? European Heart Journal, 26(24): 2714-20.
- Freed BH, L Sugeng, K Furlong et al. (2010). Reasons for nonadherence to guidelines for aortic valve replacement in patients with severe aortic stenosis and potential solutions. American Journal of Cardiology, 105(9): 1339-42.
- Philipson TJ and AB Jena. (2006). Who benefits from new medical technologies? Estimates of consumer and producer surpluses for HIV/AIDS drugs. Forum for Health Economics & Policy, 9(2): 1-33.
- Ermini Leaf D, B Tysinger, DP Goldman et al. (2020). Predicting quantity and quality of life with the Future Elderly Model. Health Economics.
- Health and Retirement Study, (RAND HRS Version P) public use dataset. (2016). Produced and distributed by the University of Michigan with funding from the National Institute on Aging (grant number NIA U01AG009740). Ann Arbor, MI.
- RAND HRS Version P. (2016). Produced by the RAND Center for the Study of Aging, with funding from the National Institute on Aging and the Social Security Administration. Santa Monica, CA.
- Centers for Medicare and Medicaid Services. (2011). Medicare Current Beneficiary Survey, 2007 cost and use data. Baltimore, MD: U.S. Department of Health and Human Services.
- Centers for Medicare and Medicaid Services. (2011). Medicare Current Beneficiary Survey, 2008 cost and use data. Baltimore, MD: U.S. Department of Health and Human Services.
- Centers for Medicare and Medicaid Services. (2012). Medicare Current Beneficiary Survey, 2009 cost and use data. Baltimore, MD: U.S. Department of Health and Human Services.
- Centers for Medicare and Medicaid Services. (2013). Medicare Current Beneficiary Survey, 2010 cost and use data. Baltimore, MD: U.S. Department of Health and Human Services.
- Goldman D, D Ermini Leaf, J Sullivan et al. (2018). The Future Elderly Model: Technical documentation. https://healthpolicy.box.com/v/FEM-Appendix.
- Iung B, G Baron, EG Butchart et al. (2003). A prospective survey of patients with valvular heart disease in Europe: The Euro Heart Survey on Valvular Heart Disease. European Heart Journal, 24(13): 1231-43.
- Carroll JD, MJ Mack, S Vemulapalli et al. (2020). STS-ACC TVT registry of transcatheter aortic valve replacement. Journal of the American College of Cardiology, 76(21): 2492-2516.
- Eggebrecht H and RH Mehta. (2019). Transcatheter aortic valve implantation (TAVI) in Germany: More than 100,000 procedures and now the standard of care for the elderly. EuroIntervention, 14(15): e1549-52.
- Varadarajan P, N Kapoor, RC Bansal et al. (2006). Survival in elderly patients with severe aortic stenosis is dramatically improved by aortic valve replacement: Results from a cohort of 277 patients aged≥ 80 years. European Journal of Cardio-thoracic Surgery, 30(5): 722-27.
- Baron SJ, K Wang, JA House et al. (2019). Cost-effectiveness of transcatheter versus surgical aortic valve replacement in patients with severe aortic stenosis at intermediate risk: Results from the PARTNER 2 trial. Circulation, 139(7): 877-88.
- Reynolds MR, Y Lei, K Wang et al. (2016). Cost-effectiveness of transcatheter aortic valve replacement with a self-expanding prosthesis versus surgical aortic valve replacement. Journal of the American College of Cardiology, 67(1): 29-38.
- Sussell J, E van Eijndhoven, TT Schwartz et al. (2020). Economic value of transcatheter valve replacement for inoperable aortic stenosis. American Journal of Managed Care, 26(2): e50-56.
- Reardon MJ and MR Reynolds. (2013). Cost-effectiveness of TAVR in the non-surgical population. Journal of Medical Economics, 16(4): 575-79.
- Reynolds MR, EA Magnuson, Y Lei et al. (2012). Cost-effectiveness of transcatheter aortic valve replacement compared with surgical aortic valve replacement in high-risk patients with severe aortic stenosis. Journal of the American College of Cardiology, 60(25): 2683-92.
- Mattke S, S Schneider, P Orr et al. (2020). Temporal trends in mortality after transcatheter aortic valve replacement: A systematic review and meta-regression analysis. Structural Heart, 4(1): 16-23.
- Lauck SB, DA Wood, J Baumbusch et al. (2016). Vancouver transcatheter aortic valve replacement clinical pathway. Circulation: Cardiovascular Quality and Outcomes, 9(3): 312-21.
- Babaliaros V, C Devireddy, S Lerakis et al. (2014). Comparison of transfemoral transcatheter aortic valve replacement performed in the catheterization laboratory (minimalist approach) versus hybrid operating room (standard approach): Outcomes and cost analysis. JACC Cardiovascular Interventions 7(8): 898-904.
- Durko AP, RL Osnabrugge, NM Van Mieghem et al. (2018). Annual number of candidates for transcatheter aortic valve implantation per country: Current estimates and future projections. European Heart Journal, 39(28): 2635-42.
- Matthew Brennan J, MB Leon, P Sheridan et al. (2020). Racial differences in the use of aortic valve replacement for treatment of symptomatic severe aortic valve stenosis in the transcatheter aortic valve replacement era. Journal of the American Heart Association, 9(16): e015879.
- Elbadawi A, SY Naqvi, IY Elgendy et al. (2019). Ethnic and gender disparities in the uptake of transcatheter aortic valve replacement in the United States. Cardiology and Therapy, 8(2): 151-55.
- Marquis-Gravel G, A Stebbins, AS Kosinski et al. (2020). Geographic access to transcatheter aortic valve replacement centers in the United States. JAMA Cardiology, 5(9): 1006-10.
- Ali N, A Faour, J Rawlins et al. (2021). “Valve for Life”: Tackling the deficit in transcatheter treatment of heart valve disease in the UK. Open Heart, 8(1): e001547.
- Kawsara A, S Sulaiman, J Linderbaum et al. (2020). Temporal trends in resource use, cost, and outcomes of transcatheter aortic valve replacement in the United States. Mayo Clinic Proceedings, 95(12): 2665-73.
- St Clair P, E Gaudette, H Zhao et al. (2017). Using self-reports or claims to assess disease prevalence: It’s complicated. Medical Care, 55(8): 782-88.
You must be logged in to post a comment.