
U.S. consumers spend roughly three times as much on drugs as their European counterparts, and 90 percent more as a share of income. Calculations using publicly available aggregate data suggest that the United States market accounts for 64 to 78 percent of worldwide pharmaceutical profits. These profits drive drug innovation that ultimately benefits patients around the globe. While American subsidies to innovation provide much-needed philanthropy to poor countries, patients in richer countries outside the United States would benefit longer-term if they financed a greater share of drug discovery. Using a previously published economic-demographic microsimulation, we estimate that if European prices were 20 percent higher, the resulting increased innovation would generate $10 trillion in welfare gains for Americans, and $7.5 trillion for Europeans over the next 50 years. Encouraging other wealthy countries to shoulder more of the burden of drug discovery — including higher prices for innovative treatments — would ultimately benefit patients in the United States and the rest of the world. Download the full paper here.
Introduction
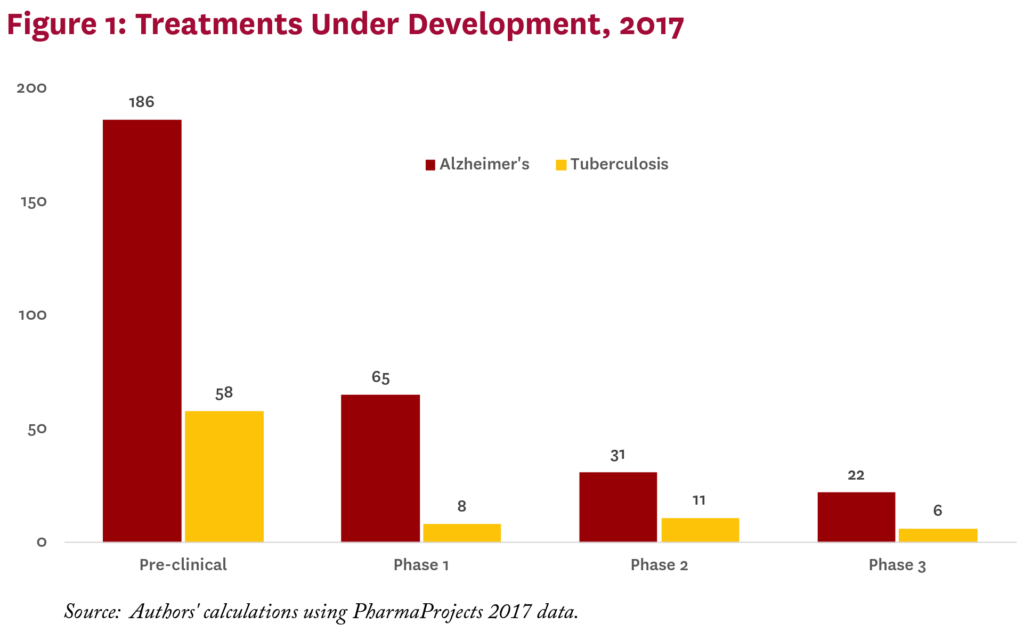
Dementia kills about 1.5 million people worldwide each year. This figure may not surprise Americans, where the problems of Alzheimer’s and dementia are (rightly) getting a lot of attention, including a Presidential Proclamation last year.1 What may surprise many Americans, however, is that tuberculosis kills about the same number of people worldwide (so does diarrhea).
The public health community emphasizes the urgency of addressing tuberculosis, noting its global burden is greater than that of any other disease, including dementia.2 This makes sense, given that tuberculosis often afflicts people at young ages and shortens their productive lifespan, whereas dementia appears much later in life. There are strong economic and moral cases for pursuing treatment for both diseases, but the biomedical industry is responding differently to them. In particular, potential treatments currently under development globally for Alzheimer’s outnumber those for tuberculosis by more than three to one (figure 1).
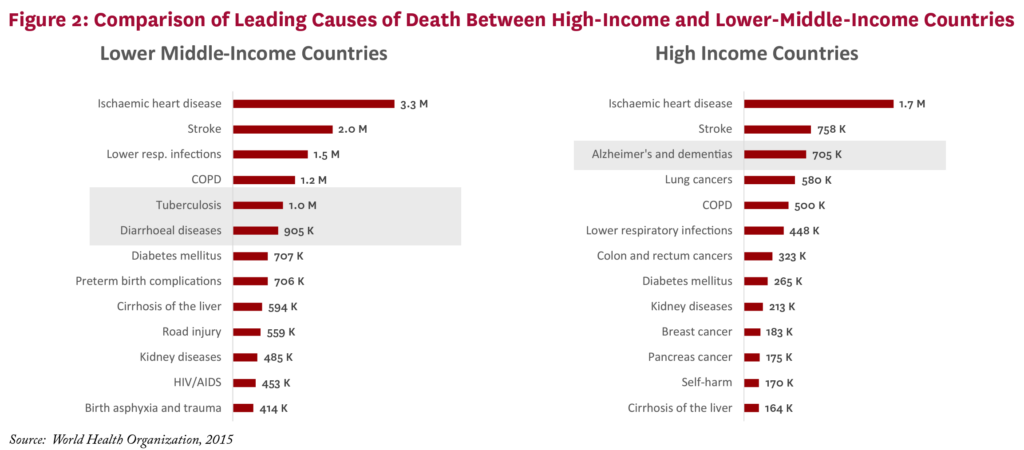
What explains the difference? In part, it’s the nature of each disease’s victims. Dementia is the third leading cause of death in high-income countries, while tuberculosis doesn’t even crack the top 13 (figure 2). The story is reversed in lower middle-income countries such as Nigeria and Indonesia — tuberculosis makes the top five, while dementia doesn’t make the list. The point is not that the life of a rich person matters more than that of a poor person, but that the amount countries are willing to pay for treatments matters in setting development priorities.
The Relationship Between Drug Spending and Drug Discovery
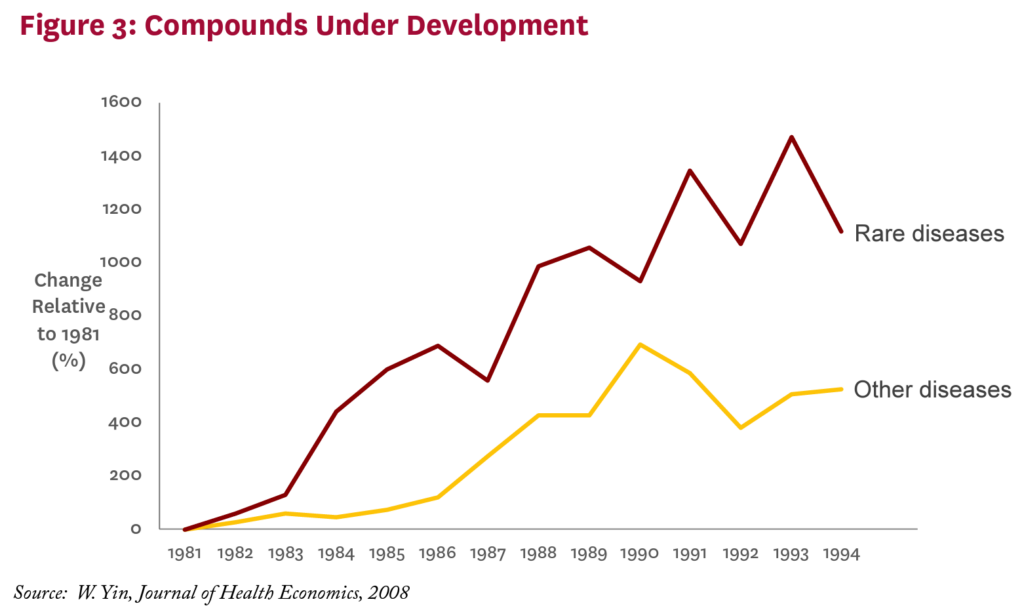
What we pay for medicines today affects the number and kinds of drugs discovered tomorrow. Empirical research has established that drug development activity is sensitive to expected future revenues in the market for those drugs. The most recent evidence suggests that it takes $2.5 billion in additional drug revenue to spur one new drug approval, based on data from 1997 to 2007.3 Another study assesses the Orphan Drug Act, passed in 1982 to stimulate development of treatments for rare diseases. Its key feature was the granting of market exclusivity that would restrict entry by competitors — in other words, allow for higher prices. The result was a dramatic increase in the number of compounds brought into development to treat rare diseases (figure 3).4 This linkage may not help patients with tuberculosis today in Nigeria and Indonesia — two poor countries hardest hit by tuberculosis — but it is currently benefiting patients in the same countries who have HIV. Decades ago, demand for HIV treatment in wealthy countries spurred medical breakthroughs that have since found their way — albeit more slowly than we would like — into the poorest corners of the globe. As of July 2017, 20.9 million people living with HIV were accessing antiretroviral therapy globally; 60 percent of them live in eastern and southern Africa.5
American consumers may feel some philanthropic pride about the benefits they have spurred for the world’s poorest HIV patients. But similar benefits are also enjoyed by German, British, and French HIV patients, and were financed by the same revenues generated, in large part, by high American drug prices. Whether one sees this as philanthropy on the part of American drug buyers, or free-riding on the part of other wealthy countries who pay much less for the same drugs, America clearly contributes more to pharmaceutical revenue, and hence incentives for new drug development, than its income and population size would suggest.
America’s Contribution to Worldwide Pharmaceutical Profits
U.S. consumers spend roughly three times as much on drugs as their European counterparts.6, i Even after accounting for higher U.S. incomes, Americans spend 90 percent more as a share of income.ii Indeed, North American consumers spend about 3.5 times the price per dose of medicine taken, including generics, compared to their European counterparts, even though their income is only 60 percent higher.7 Prior research suggests that a substantial share of this gap is due to greater use of newer and higher-strength medicines in the U.S.iii,8 The rest is due to lower prices for the identical drug overseas.
A back-of-the-envelope calculation suggests that U.S. consumers account for about 64 to 78 percent of total pharmaceutical-profits, despite accounting for only 27 percent of global income. In 2016, total global spending on pharmaceuticals amounted to $1.1 trillion.6 Estimates of pharmaceutical industry net profit margins range widely, from 12 percent10 to 26 percent,11 resulting in total global pharmaceutical profits ranging from $139 to $290 billion.
If every country faced the same drug prices and used the same mix of drugs, global pharmaceutical profits would be generated on a pro-rata basis, according to where revenues are earned. However, this is not the case. American patients use newer drugs and face higher prices than patients in other countries.8 Both these factors drive up the American contribution to global profits, but to illustrate the point, we focus only on the price differences and ignore variation in the mix of drugs (a more detailed derivation is available in the online technical appendix12). Empirical estimates find that American prices are 20-40 percent higher than prices in eleven other developed countries;8 for this analysis we use the (conservative) lower bound of 20 percent. Branded drug revenues in America are about $334 billion,13 with about $134 billion attributable to higher prices. (Note that pure price increases do not change quantity or manufacturer costs, so any price increase goes directly to profits.) Put differently, if American prices dropped to overseas levels, global profits would fall by $134 billion. Thus, 46 to 96 percent of global profits ($134 billion of global profits ranging from $139 to $290 billion) can be attributed to higher prices in America.
We use the conservative assumption that every country uses the same mix of drugs to apportion the remaining global profits between the U.S. and the rest of the world, as detailed in the technical appendix.12 All told, under up the American contribution to global profits, but to illustrate the point, we focus only on the price differences and ignore variation in the mix of drugs (a more detailed derivation is available in the online technical appendix12). Empirical estimates find that American prices are 20-40 percent higher than prices in eleven other developed countries;8 for this analysis we use the (conservative) lower bound of 20 percent. Branded drug revenues in America are about $334 billion,13 with about $134 billion attributable to higher prices. (Note that the conservative approach that uses the highest net margin estimate (26 percent11), the lowest generic spending estimate ($225 billion14), and the smallest U.S. price premium (20 percent8), we find that the United States market accounts for 64 percent of global profits. Under more plausible assumptions — including smaller net margins of 20 percent and higher global generic spending of $425 billion15 — the share rises to 78 percent.
What If Other Rich Countries Pulled Their Weight?
High drug prices in America have spurred discussions about policy interventions to lower them, essentially bringing them closer to drug prices in other countries. These discussions in turn raise concerns about how such policies would impact future innovation. An entirely different approach asks: What would happen if other countries paid drug prices closer to those in the United States?
We examined this issue in detail using the Future Elderly Model (FEM), an economic-demographic microsimulation developed at the USC Roybal Center for Health Policy Simulation, a part of the USC Schaeffer Center, with funding from the National Institute on Aging. The FEM has been used to explore a variety of policy questions, ranging from the fiscal future of the U.S., to the role biomedical innovation can play in future health outcomes.
Increasing European prices by 20 percent — just part of the total gap — would result in substantially more drug discovery worldwide, assuming that the marginal impact of additional investments is constant. These new drugs lead to higher-quality and longer lives that benefit everyone. After accounting for the value of these health gains — and netting out the extra spending — such a European price increase would lead to $10 trillion in welfare gains for Americans over the next 50 years. But Europeans would also be better off in the long run, by $7.5 trillion, weighted towards future generations.12 This is because European populations are rapidly aging, and they need new drugs too. For example, if the burden of dementia in Europe is as high as it is in the U.S., its social costs could be $1 trillion annually. If higher prices in Europe spurred just a few innovators to develop effective dementia treatments, the added costs could easily be justified. In other words, low prices in Europe not only hurt Americans, they hurt Europeans.16, 17
One issue that is often raised is whether the profits from higher prices will all go directly into research and development. They almost certainly won’t. Owners and employees would share in any gains in the form of dividends, retained earnings, and compensation. There are other ways to finance innovation other than high prices, for example through public research (paid by taxes) and philanthropy. At the end of the day, however, evidence conclusively demonstrates that higher expected revenues leads to more drug discovery, with the most recent numbers suggesting that on average every $2.5 billion of additional revenue leads to a new drug approval.3
Policy Solutions
Pressure is building in the United States for the federal government to take action to regulate drug prices. Proponents contend that consumers will benefit from lower prices, while critics contend that reducing future revenues will slow innovation. The debate thus centers on the trade-off between benefiting the current generation (with lower prices) and benefiting future generations (with greater pharmaceutical innovation and access to new drugs), as well as the extent to which alternative policy approaches can balance this trade-off.
However, if other wealthy countries shouldered more of the burden for medical innovation, both American and European patients would benefit. More can be done through trade deals. Some argued that the Obama Administration’s proposed Trans-Pacific Partnership would have raised prices for drugs internationally by offering more protection of intellectual property — as if this was a bad deal.18 In fact, the research suggests it could benefit all parties in the long term.
Other measures can help as well. We can spur innovation by lowering drug development costs through international harmonization of regulatory standards. This effort has been going on for decades and has made progress. Attempts to create mutual recognition of marketing approvals tend to be controversial, but data sharing and common standards (for example for the validation of biomarkers) are possible.
We also need more research on the costs that free-riding imposes on the global patient population. As incomes in less-developed countries rise, they will face the challenges of fighting conditions like diabetes, heart disease, and even dementia. Spending a bit more now to ensure their populations have access to effective treatment is in everyone’s interest.
In April 2017, the Schaeffer Center hosted a panel discussion featuring Sir Michael Rawlins, Chair of the UK’s Medicine and Healthcare Products Regulatory Agency — Britain’s equivalent of the FDA — who emphasized the global importance of continuing pharmaceutical innovation. Recognizing the costs of developing new drugs, he said, “you are talking about a lot of money. And thank you very much to the United States” for shouldering that burden.
You’re welcome.
Technical Appendices
Global Innovation Technical Appendix (PDF)
Global Pharmaceutical Policy Model (GPPM) Technical Appendix (2007) (PDF)
Supplemental Materials
Policy Options for European Markets (2008)
Footnotes
- i. U.S. consumers are compared to consumers in the five largest European markets: France, Germany, Italy, Spain, and the United Kingdom. Pharmaceutical spending data are from QuintilesIMS Institute (2016), “Outlook for Global Medicines through 2021,” December 2016. Population and income (gross domestic product) data are from the World Bank.
- ii. Authors’ calculations based on IMS and World Bank data.
- iii. While some have argued that new drugs are approved faster in Europe than in the U.S., Europe imposes stronger restrictions on the use of new medicines.9 The net result is greater use of newer medications in the U.S
References
- U.S. President. (2016). National Alzheimer’s Disease Awareness Month, 2016, Proclamation 9534. Federal Register Retrieved from https://www.gpo.gov/fdsys/pkg/FR-2016-11-03/pdf/2016-26801.pdf.
- Kyu, H. H., Maddison, E. R., Henry, N. J., Mumford, J. E., Barber, R., Shields, C., . . . Murray, C. J. L. (2017). The global burden of tuberculosis: results from the Global Burden of Disease Study 2015. The Lancet Infectious Diseases. doi:10.1016/S1473-3099(17)30703-X
- Dubois, P., de Mouzon, O., Scott-Morton, F., & Seabright, P. (2015). Market size and pharmaceutical innovation. The Rand Journal of Economics, 46(4), 844-871.
- Yin, W. (2008). Market incentives and pharmaceutical innovation. Journal of Health Economics, 27(4), 1060-1077. doi:10.1016/j.jhealeco.2008.01.002
- UNAIDS. (2017). Fact sheet – Latest statistics on the status of the AIDS epidemic. Retrieved from http://www.unaids.org/en/resources/factsheet
- QuintilesIMS Institute. (2016). Outlook for Global Medicines through 2021. Retrieved from https://morningconsult.com/wp-content/uploads/2016/12/QuintilesIMS-Institute-Global-Outlook-FINAL.pdf
- IMS Institute for Healthcare Informatics. (2015). Global Medicines Use in 2020: Outlook and Implications. Retrieved from https://morningconsult.com/wp-content/uploads/2016/04/IMS-Institute-US-Drug-Spending-2015.pdf
- Danzon, P. M., & Furukawa, M. F. (2008). International Prices And Availability Of Pharmaceuticals In 2005. Health Affairs, 27(1), 221-233.
- Sood, N., De Vries, H., Gutierrez, I., Lakdawalla, D. N., & Goldman, D. P. (2009). The effect of regulation on pharmaceutical revenues: experience in nineteen countries. Health Affairs, 28(1), w125-w137.
- Damodaran, A. (2018). Margins by Sector (US). Retrieved from http://pages.stern.nyu.edu/~adamodar/New_Home_Page/datafile/margin.html
- Sood, N., Shih, T., Van Nuys, K., Goldman, D. (2017). The Flow of Money Through the Pharmaceutical Distribution System. USC Schaeffer Center White Paper.
- Online technical appendix available at: http://healthpolicy.usc.edu/Global_Burden_of_Medical_Innovation.aspx
- QuintilesIMS. Brand and generic prescription medication revenue in the U.S. from 2006 to 2016 (in billion U.S. dollars). Retrieved from https://www.statista.com/statistics/205043/total-brand-to-generic-prescription-medication-sales/
- Zion Market Research. (2016). Global Generic Market is Set for a Rapid Growth and is Expected to Reach USD 380.60 Billion by 2021. Retrieved from https://www.zionmarketresearch.com/news/global-generic-drug-market
- IQVIA Institute for Human Data Research, figures provided in personal communications.
- Lakdawalla, D., Goldman Dana, P., Michaud, P., Sood, N., Lempert, R., Cong, Z., . . . Gutierrez, I. (2008). Policy Options for European Pharmaceutical Markets. Working Paper, RAND Corp.
- Lakdawalla, D. N., Goldman, D. P., Michaud, P. C., Sood, N., Lempert, R., Cong, Z., . . . Gutierrez, I. (2009). U.S. pharmaceutical policy in a global marketplace. Health Affairs, 28(1), w138-150.
- Marans, D., & Walsh, B. (2015). “Historic Trade Deal Confirms Critics’ Worst Fears”. Retrieved from https://www.huffingtonpost.com/entry/ trade-deal-confirms-advocates-worst-fears_us_563b9061e4b0411d306ff765
Disclosures: Support for this project was provided by the Schaeffer Center for Health Policy & Economics and the National Institute on Aging of the National Institutes of Health under award number P30AG024968. The views expressed herein are those of the authors and do not represent the views of the Center or its supporters. Goldman and Lakdawalla are co-founders of Precision Health Economics and hold equity in its parent company.
You must be logged in to post a comment.