Schaeffer Center White Paper Series | DOI: https://doi.org/10.25549/hypg-r802
Abstract
US spending on prescription drugs has been growing rapidly, prompting calls for government intervention to slow the upward trend. But any intervention should be predicated on a clear understanding of the economic forces that drive price increases, and the parties responsible for them. We collect gross and net profit data from the 2015 US Securities Exchange Commission regulatory filings of the largest publicly traded companies in the pharmaceutical distribution system, and use them to describe the flow of funds across the drug distribution system to understand how much each sector profits from its transactions. Gross (net) margins average 71% (26%) for manufacturers, 22% (3%) for insurers, 20% (4%) for pharmacies, 6% (2%) for pharmacy benefit managers and 4% (0.5%) for wholesalers. These margins imply that for every $100 spent at retail pharmacies, about $17 compensates for direct production costs, $41 accrues to the manufacturer ($15 of which is net profit), and $41 accrues to intermediaries in the distribution system: wholesalers, pharmacies, pharmacy benefit managers and insurers (with $8 of net profit split among them). The allocations differ depending on whether the drug is generic or branded. Manufacturers have higher gross profit margins for branded drugs and intermediaries have higher gross profit margins for generic drugs. Gross margins on generic drugs are lower for manufacturers (50%), and much higher for pharmacies (43%). More than $1 in every $5 in spending on prescription drugs goes towards profits of firms in the pharmaceutical distribution system. While the current analysis cannot say definitively whether any sectors make excessive profits, greater scrutiny of pricing policies of each sector and more competition throughout the distribution system is warranted.
Introduction
Prescription drugs sold in retail pharmacies accounted for almost $325 billion or 10% of total healthcare costs in 2015, up 9% from 2014.1 Such dramatic growth has prompted calls for government intervention to regulate drug prices or otherwise control their rapid increase.2 But any intervention should be predicated on a clear understanding of the economic forces that drive price increases, and the parties responsible for them.
Sign up for Schaeffer Center news
Much attention has focused on the average wholesale or “list” price set by manufacturers prior to discounts. These prices have been increasing—the average list price of branded drugs rose 12.4% in 2015, and has increased 10% or more annually since 2012.3 Yet list prices rarely represent what manufacturers are paid for drugs, as they are routinely discounted and rebates paid to various parties in the distribution system.
Net prices—which include all discounts and rebates—have also risen, albeit more slowly to 2.8% in 2015.3 Yet even the net price that manufacturers receive does not fully represent what patients pay (through a combination of out-of-pocket payments and insurer reimbursements).
The difference between what patients pay and what manufacturers receive is allocated among other stakeholders in the drug distribution chain, including insurers, pharmacy benefit managers (PBMs), pharmacies, and wholesalers. Contracts among these players govern the exchange of goods (drugs) or services (such as logistics or claims administration) for various fees, discounts, rebates, and chargebacks. Such arrangements are typically privately negotiated and undisclosed, making it difficult to determine precisely how these payments are distributed.
However, publicly traded companies in the distribution system must disclose annual financial information to the US Securities and Exchange Commission (SEC) and other regulatory agencies, and from those data we can examine the flow of funds from the insurer back to the manufacturer, and the relative profitability at each step. The results illuminate opportunities to reduce total drug spending.
Methods
We estimated the flow of funds in the distribution system by first developing a conceptual framework to illustrate the flow of goods, services, and funds among system participants. Next, we used data from financial statements, regulatory filings and other sources to estimate the average gross and net profit margins of companies along the distribution system. We applied these estimates to calculate the proportion of funds retained at each step in the process, and used them to illustrate how $100 in retail prescription drug expenditures is allocated across players in the distribution system.
Conceptual Framework
Using information from four published sources, we developed a conceptual framework of pharmaceuticals distributed in retail settings, illustrated in Figure 1.4-7
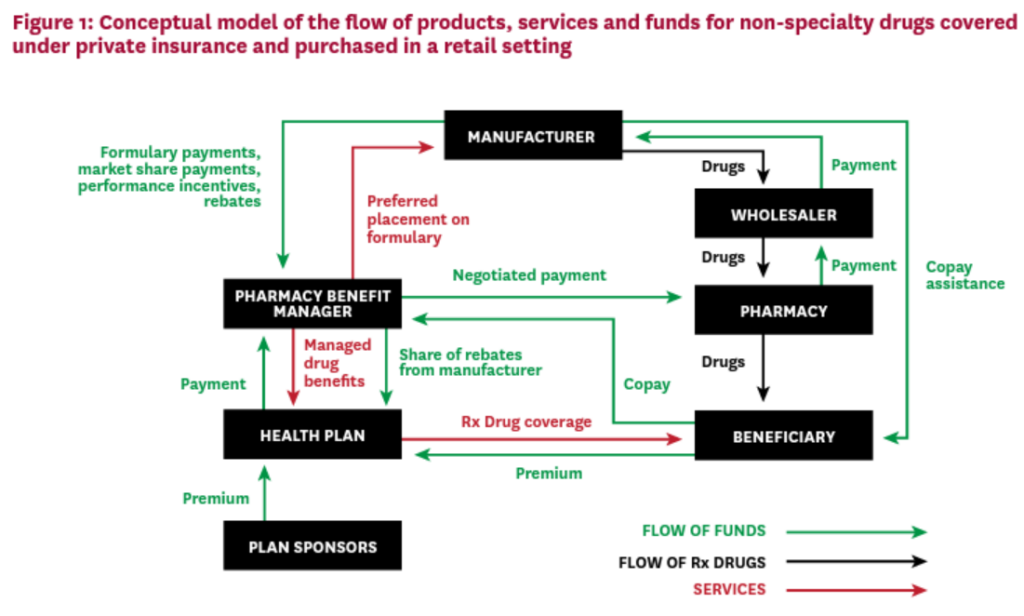
Beneficiaries and sponsors pay premiums to a health plan, in exchange for drug coverage benefits for plan members. The health plan or self-insured employer contracts with a PBM to manage the plan’s drug benefit in exchange for fees and payments. The PBM negotiates with drug manufacturers to provide preferred formulary placement for the manufacturers’ products, in exchange for discounts from list price, rebates, incentives and other fees payable to the PBM.
The PBM also negotiates contracts with pharmacies, including those in its network, to set reimbursements for the drugs dispensed by the pharmacy. Pharmacies in turn negotiate agreements with drug wholesalers, setting the wholesale rates at which they obtain the drugs, and wholesalers negotiate to buy drugs from manufacturers and distribute them to pharmacies.
When a covered beneficiary fills a prescription at a retail pharmacy, the pharmacy collects the beneficiary’s copayment or coinsurance and dispenses the drug from inventory. The pharmacy passes the copayment to the PBM, and the PBM pays the pharmacy the negotiated reimbursement. To re-stock inventory, the pharmacy purchases drugs from the wholesaler, who purchases them from the manufacturers. Periodically (e.g. quarterly), the PBM reconciles drug claims and the manufacturer pays the PBM any rebates, incentive payments or fees owed based on their negotiated contracts. The PBM may pass some of these funds on to the plan sponsors, according to the contracts negotiated with each plan.
Data and Statistics
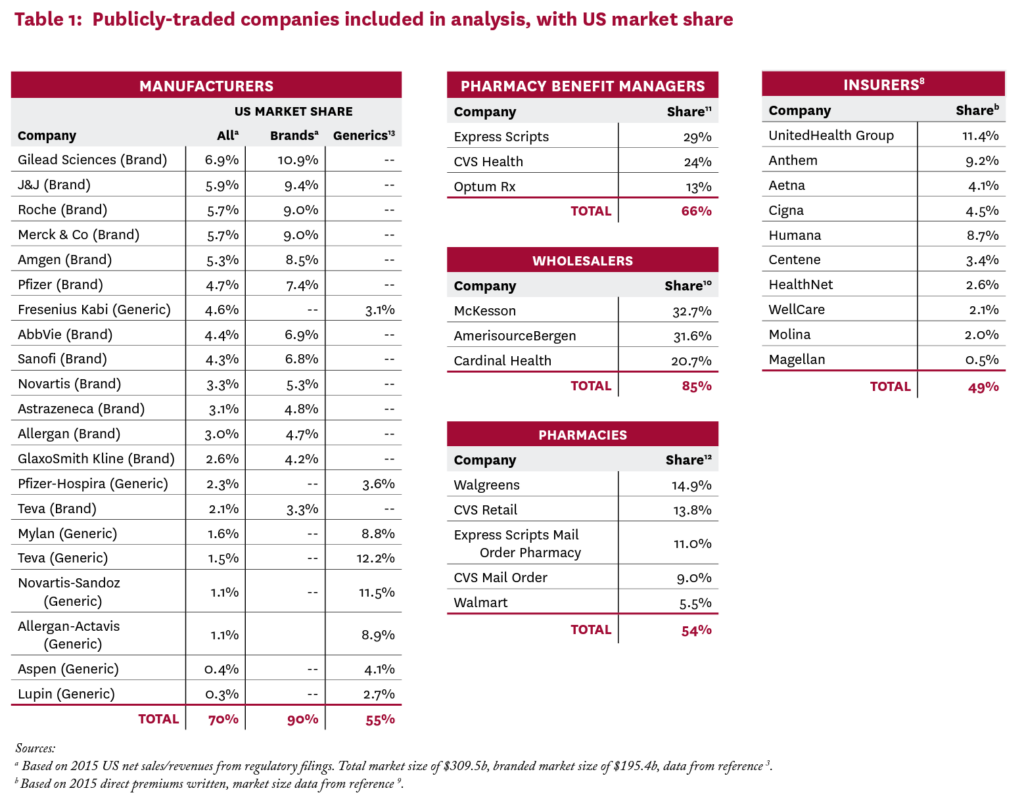
We collected data on the largest public companies for each sector described in Figure 1: insurers, PBMs, pharmacies, wholesalers and manufacturers. We used public sources to identify the largest publicly traded companies in each sector until at least half of the total market was represented.3,8-13 For health insurers, our sample only accounts for 48% of the premiums written, because many large insurers are private, not for profit, or mutual. Table 1 lists the included companies and their respective market shares.
Our objective was to estimate average gross and net profit margins for each sector in the distribution system described in Figure 1, and use them to calculate the proportion of the aggregate flow of funds captured by each sector. In this distribution system, each sector supplies goods or services to customers in exchange for payment (revenue). Some of that revenue is in turn passed from the original supplier to the next player in the chain, as payment for the raw goods and services needed to produce the product, called “cost of goods sold.” The remaining funds, or gross profit, are captured in the sector, and may be used in several ways, including to fund research and development (R&D), marketing, general and administrative activities (SG&A), or provide a return to owners (net earnings or profits).
Gross and Net Margins
A company’s gross profits are the difference between revenues received and costs of goods sold; gross margin is this amount expressed as a percent of revenues. For example, gross profits for wholesalers are revenues received primarily from pharmacies less payments made primarily to manufacturers. Some of these gross profits are spent on other business expenses such as marketing, R&D, depreciation, interest, and taxes. What remains after subtracting these expenses is net profits, which accrue to the shareholder owners of the firm.
We estimated gross and net margins as a fraction of net revenues for all companies using information from their 2015 SEC filings (forms 10K and 20F). To the extent that SEC filings allowed, we isolated financial data for US pharmaceutical operations and for the sector of interest. For example, for a company with both specialty pharmacy and PBM divisions that report separate financial results for each, we used PBM division data to estimate margins for the PBM business. In some cases, it was not possible to isolate the results of pharmaceutical business activities—for example, health insurers do not report financial results for their pharmaceutical claims activity separate from medical claims activity. In these cases, our margin estimates include activities of other types of business. When data did not permit a US-specific margin to be calculated, we used the global margin. (See Appendix Section A for more detail.)
Sign up for Schaeffer Center news
We also calculated separate gross margins for branded and generic drugs for each sector. For manufacturers, we categorized each company as either a branded or generic producer, and calculated separate gross and net margins for each.13 For pharmacies, we used the National Average Drug Acquisition Cost (NADAC) and the National Average Retail Price (NARP) datasets from the Centers for Medicare and Medicaid Services (CMS) for 2013, and calculated gross margins as described in Appendix Section B, analyzing generic and branded subsamples separately. The SEC filings of wholesalers and insurers do not report results of generic and branded activity separately, so we could not estimate drug-type specific margins for them. Instead, we used other published estimates of gross margins specific to brand and generic drugs.14,15
Simulating the Flow of Funds
To illustrate the implications of our estimates, we explore a hypothetical scenario in which $100 is spent on prescription drugs acquired at a retail pharmacy using commercial insurance. We apply the average sector gross margins to the incoming funds to each sector to identify how much is retained in each sector, and apply the average sector net margins to identify the funds that are kept as net profits. This process was applied throughout the distribution system, as detailed in Section D of the Appendix. The funds passed through the last step are assumed to be production costs to manufacture the drugs.
The first step in the chain requires further explanation. Of a $100 expenditure on prescription drugs obtained at a retail pharmacy, some portion is paid out-of-pocket by the patient, in the form of copayments and co-insurance, and goes directly to the PBM.d The remaining funds originate with the insurer as premium revenue, and the insurer’s gross margin is applied to this amount, rather than the full $100, to calculate the amount retained in the insurance sector.
The proportion of total drug expenditures originating as premiums was estimated using data from the 2014 Medical Expenditure Panel Survey (MEPS), which provides annual total prescription drug expenditures and out-of-pocket payments (see Appendix Section C for detail). For all other sectors, all funds flowing into the sector are assumed to come directly from the sector immediately upstream—that is, all manufacturers’ revenue is passed through from wholesalers, all wholesalers’ revenue is passed through from pharmacies, etc.
Finally, we compare the average net margins estimated for pharmaceutical distribution system participants to the average net margins of public companies in similar industries, which are published annually.16 Drug manufacturers are compared to other consumer and business product manufacturers, drug wholesalers are compared to food wholesalers, health insurers to other types of insurance companies, and pharmacies to other retail businesses. PBMs are compared to the category of real estate operations and services, which includes real estate agents and brokers, who also negotiate and act as intermediaries in transactions between third parties.
Results
Average US sales-weighted gross and net margins for each sector in the distribution system are reported in Table 2, as are gross margins for the branded and generic markets separately. For all drugs combined, gross margins are highest for manufacturers at 71.1%, followed by insurers (22.2%), pharmacies (20.1%), PBMs (6.3%) and wholesalers (3.7%). Net margins are significantly lower for all parties, ranging from 26.3% for manufacturers to 0.5% for wholesalers. In the branded market, gross margins are higher for manufacturers (76.3%) and lower for the other distribution system parties (except for insurers, for whom drug-type-specific margins could not be estimated), while in the generic drug market, the opposite is true: margins are lower for manufacturers (49.8%), and higher for all other distribution system participants (again, excepting insurers), including pharmacies, with generic gross margins of 42.7%. Net margins by drug type are only available for manufacturers, falling significantly below their gross margins, at 28.1% for brand drugs and 18.2% for generics.
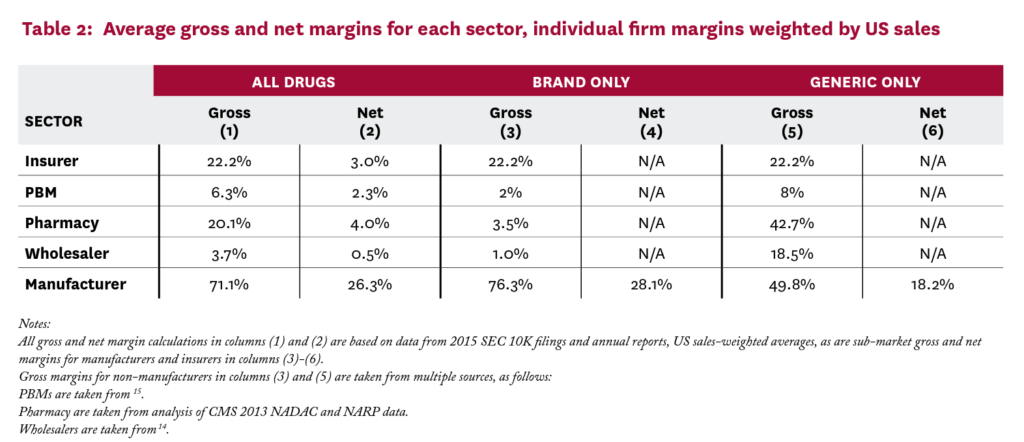
Figure 2 applies the gross and net margin estimates in Table 2 to illustrate the average flows of funds to distribution system participants for branded and generic drugs combined Of a $100 expenditure on pharmaceuticals by consumers (composed of both out-of-pocket and insurer payment), roughly $17 goes to drug production costs, $41 accrues to the manufacturers (a third of which is net profit), and $19 accrues to insurers ($3 of which is net profit). PBMs keep about $5 ($2 net profit), pharmacies keep $15 ($3 net profit), and wholesalers keep about $2 (30 cents net profit). Total net profit on a $100 expenditure is $23, of which $15 is captured by manufacturers and the remaining $8 by intermediaries.
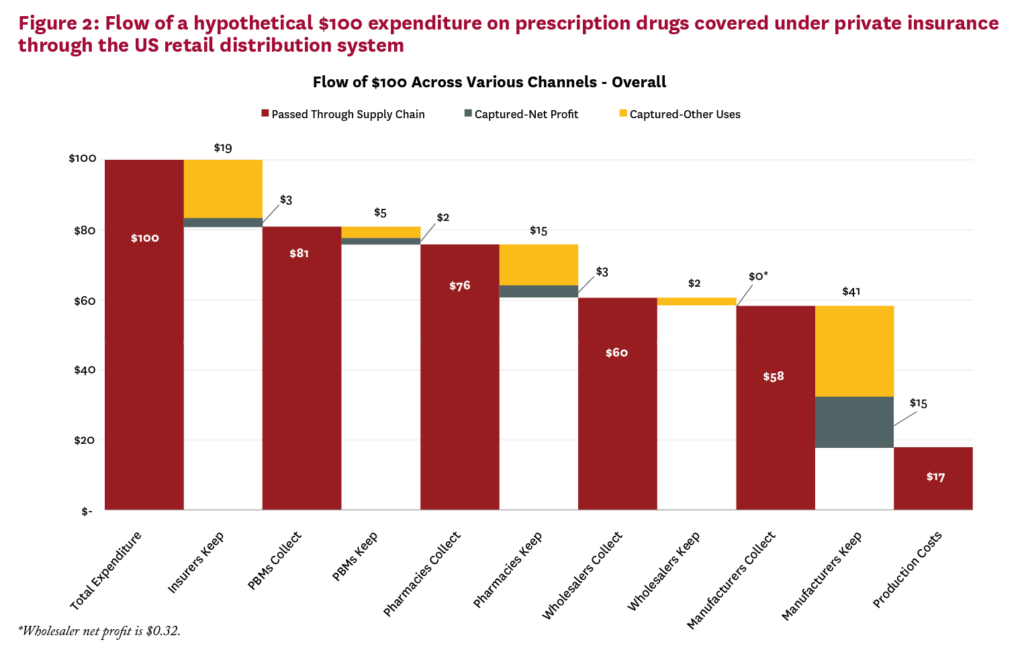
Figure 3 shows the results of similar analyses conducted separately for branded (Panel A) and generic (Panel B) drugs, and demonstrates important differences in how funds accrue to distribution system players across these market segments.
While manufacturers make about three times the gross profits on branded vs. generic drugs ($58 vs. $18, consistent with the market exclusivity granted to patented drugs), other segments make much more on generic expenditures: PBMs make four times as much on generic drugs compared to brands, while wholesalers make eleven times as much, and pharmacies almost twelve times as much, $32 compared to $3.
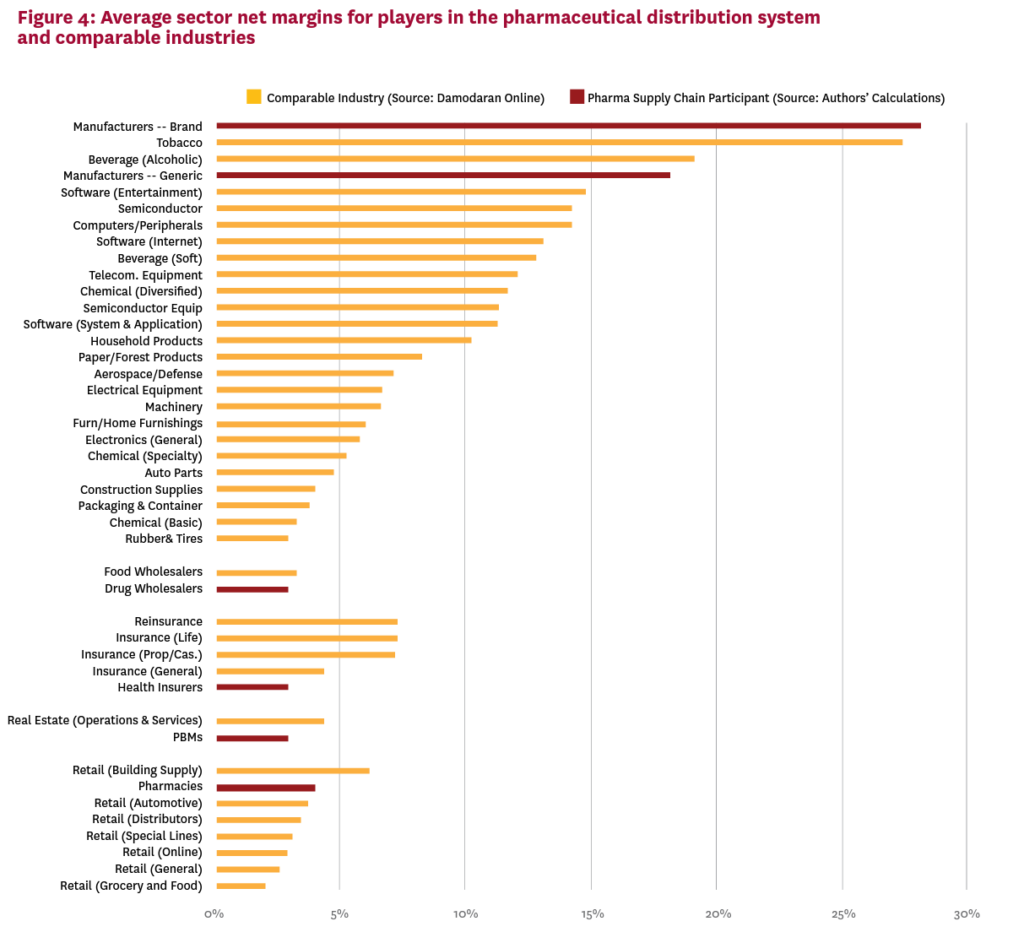
Figure 4 compares the net margins for players in the pharmaceutical distribution system to those in similar industries, based on published estimates of average net margins for 100+ industries.16 Drug manufacturers and pharmacies had higher margins than most comparator industries.
Margins for all participants were validated with previously published estimates whenever possible. See Appendix Section B for more details.
Discussion
Given large and increasing expenditures for pharmaceutical drugs in the US, an understanding of who profits from this spending—and by how much—is of great policy salience. Identifying these flows is challenging because available data are highly aggregated and permit only a high-level view of a complex distribution system. Despite these limitations, we argue the aggregate picture can illuminate features of the distribution system and guide further inquiry.
We demonstrate that gross and net margins vary widely across distribution sectors, prompting the question whether companies are making excessive returns. Market concentration is an important indicator of companies’ ability to earn extraordinary returns, and several segments in the US pharmaceutical distribution system are highly concentrated. The top three PBMs, wholesalers and retailers account for 85%, 66% and 49% of their markets, respectively. Barriers to entry are another source of market power, and Joseph Stiglitz has argued that “[t]oday’s markets are characterized by the persistence of high monopoly profits,” citing pharmaceutical manufacturing as one example.17
This market power manifests in practices that might raise consumer prices. For example, pharmacies charge widely varying prices for exactly the same product, and the uninsured often pay higher prices than insured consumers.18 Some players claim market concentration is good for consumers. For example, PBMs argue that their large size gives them bargaining power to negotiate lower prices for their clients.19,20 Less clear is the extent to which these savings are passed on to health plans and consumers. PBMs carefully guard information about the size of negotiated rebates and discounts, which may enhance their ability to negotiate lower prices, but also masks whether they are indeed lowering the prices paid by patients and insurers as claimed. In fact, recently proposed legislation intended to lower drug prices would require PBMs to disclose rebates and the share passed on to health plans.21
Sign up for Schaeffer Center news
While the market for manufacturers is less concentrated, patents and market exclusivity for many products confer a complete monopoly for those drugs. Brand manufacturers’ net profit margins fall at the upper end of the distribution for manufacturing industries, suggesting excessive returns. Estimated net margins for the other distribution system segments except pharmacies are comparable to those of similar non-pharma industries. However, returns for manufacturers, particularly branded drugs, must compensate for the risk taken in drug development. Other manufacturing industries where intellectual property protections are important, including software, semiconductors, and computer equipment also demonstrate higher margins.
Nonetheless, manufacturers also engage in some questionable practices. Manufacturers of branded drugs facing competition from new generic entrants may fund copay assistance programs that reduce patients’ out-of-pocket costs, dissuading them from switching to cheaper generics and circumventing insurer formularies designed to encourage such switching.22 Manufacturers have also been scrutinized for off-label promotion of drugs and anticompetitive pricing practices, including the ongoing investigation surrounding rising insulin prices.23
Finally, insurer practices also have competing effects on consumer drug costs. On one hand, they exert downward pressure on prices when they place the products of manufacturers who refuse to lower prices in higher cost-sharing or copayment tiers. But the resulting high out-of-pocket costs burden consumers who need these expensive drugs, and lower adherence. The practice also doubly penalizes those who do not respond to less expensive therapies.24
Sometimes consumers pay more for a prescription than the insurer’s cost of acquiring the drug—a common experience in high deductible health plans. Members who have not exhausted their deductible pay out-of-pocket the full average wholesale 8 price for drugs, although the plan acquires them at a discount and collects the associated manufacturer rebate.25 For generic drugs, consumers’ copays may exceed the cost of the drug. By contrast, patients would not likely tolerate paying an office visit copayment that exceeded their physician’s reimbursement.
In summary, we find that more than $1 in every $5 in spending on prescription drugs goes towards profits of firms in the pharmaceutical distribution system. While the current analysis cannot say definitively whether any sectors are making excessive profits, our results are consistent with profit-making behavior on the part of all sectors. Greater scrutiny of their pricing policies and more competition throughout the distribution system is warranted. The question of what drives high intermediary profits on generic products is especially interesting.
This work has several limitations, many resulting from data shortcomings. Key data are not always publicly available, and even the data presented in financial statements may be reported in inconsistent and opaque ways.26 Some of the largest players in certain sectors are privately held and make no financial data public. Thus, all our estimates are to some extent incomplete and inexact.
Also, this analysis shows an aggregated picture of the retail pharmaceutical distribution system. It does not represent the flow of funds for any particular drug or firm, and indeed, those pictures may vary across settings and from that presented here. An important category that is not well characterized here is that of specialty drugs, such as biologics for rheumatoid arthritis or expensive HIV therapies. Some manufacturer and insurer margin estimates here may include specialty drugs, but they are generally not distributed through retail pharmacies. Instead, they are handled through specialty pharmacies, the largest of which are owned by PBMs. Physician administered specialty drugs often add another player to the distribution system, the group purchasing organization, which negotiates on behalf of hospitals and physicians for volume discounts.
Any policy effort to control drug prices through regulation or other means would benefit from greater transparency and granularity in reporting of each sector’s financials, which is required to fully understand the dynamics in specific market segments. In this regard, recent initiatives by several pharmaceutical manufacturers to provide more price transparency are welcome.27-29 In any case, efforts to control drug costs should focus on the rents enjoyed by all players in the distribution system.
Disclosures
Support for this project was provided by the Schaeffer Center for Health Policy & Economics and by Amgen through a contract with Precision Health Economics. The views expressed herein are those of the authors and do not represent the views of the funders, and the sponsors had no role in the research. Goldman is a co-founder of Precision Health Economics and holds equity in its parent company. Sood and Van Nuys have served as consultants to Precision Health Economics.
Footnotes
d. PBMs typically include retail pharmacy co-payments in their reported revenue.
References
- Murray Aitken, Michael Kleinrock, Pennente K. Medicines Use and Spending in the U.S.—A Review of 2015 and Outlook to 2020. Parsippany, NJ: IMS Institute for Healthcare Informatics; 2016.
- Rau J. Poll Finds Majority Of Americans Want Restraints On Drug Prices. Kaiser Health News 2016. http://khn.org/news/ poll-finds-majority-of-americans-want-restraints-on-drug-prices. Accessed September 29.
- Aitken M. Medicines Use and Spending in the U.S.: A Review of 2015 and Outlook to 2020. Parsippany, NJ: IMS Institute for Healthcare Informatics; 2016.
- Federal Trade Commission. Pharmacy Benefit Managers: Ownership of Mail-Order Pharmacies. 2005:4-10. https://www.ftc.gov/reports/pharmacy-benefit-managers-ownership-mail-order-pharmacies-federal-trade-commission-report. Accessed July 15, 2016.
- Congressional Budget Office. Prescription Drug Pricing in the Private Sector. 2007:11. https://www.cbo.gov/sites/default/ files/110th-congress-2007-2008/reports/01-03-prescriptiondrug. pdf. Accessed July 15, 2016.
- Appleby J. Filling A Prescription? You Might Be Better Off Paying Cash. Kaiser Health News. June 26, 2016.
- Rubenstein E. AMCP Guide to Pharmaceutical Payment Methods. Alexandria, VA: Academy of Managed Care Pharmacy; 2013.
- Forbes.com. The Biggest Health Insurers in the US. Forbescom. https://www.forbes.com/pictures/geji45fhhm/the-biggest-healthinsur/ – 37aad6936b69.
- Insurance Information Institute. Top 10 Health Insurance Groups By Direct Premiums Written, 2015.
- Fein AJ. 2015 MDM Market Leaders | Top Pharmaceuticals Distributors. mdmcom. https://www.mdm.com/2015-top- pharmaceuticals-distributors.
- Fein AJ. PBM Market Share, by Total Equivalent Prescriptions, 2014. DrugChannelsnet. 2015. https://4.bp.blogspot.com/QQoTMCJshAk/VRm01PMxR_I/AAAAAAAAHCE/x9GC8Zmp2MQ/s1600/PBM_Market_Share_by_Total_Equivalent_ Prescriptions_2014.png. Accessed March 31.
- Fein AJ. The Top 15 Pharmacies of 2015. DrugChannelsnet. 2016. http://www.drugchannels.net/2016/01/the-top-15-pharmaciesof-2015.html. Accessed January 28.
- Palmer E. Top 20 generics companies by 2014 revenue. FiercePharma. http://www.fiercepharma.com/special-report/top20-generics-companies-by-2014-revenue.
- Fein AJ. 2015-16 Economic Report on Pharmaceutical Wholesalers and Specialty Distributors. Philadelphia, PA: Drug Channels Institute; 2015.
- Fein AJ. The 2016 Economic Report on Retail, Mail and Specialty Pharmacies. Philadelphia, PA: Drug Channels Institute; 2016.
- Damodaran Online. 2017. http://people.stern.nyu.edu/adamodar/ New_Home_Page/data.html. Accessed January.
- Stiglitz J. Are markets efficient, or do they tend towards monopoly? The verdict is in. WEF Agenda 2016.
- Arora S, Sood N, Terp S, Joyce GF. The Price May Not Be Right: The Value of Comparison Shopping for Prescription Drugs. American Journal of Managed Care. Forthcoming.
- Liss S. Express Scripts CEO addresses drug pricing ‘misinformation’. St. Louis Post-Dispatch. February 17, 2017.
- Thomas K. A Push to Lower Drug Prices that Hit Insurers and Employers the Hardest New York Times. September 8, 2016.
- Wyden Calls for Increased Drug Pricing Transparency to Lower Costs [press release]. March 15 2017.
- Dafny L, Ody C, Schmitt M. When Discounts Raise Costs: The Effect of Copay Coupons on Generic Utilization. NBER Working Paper 22745. 2016.
- Thomas K. Drug Makers Accused of Fixing Prices on Insulin The New York Times 2017.
- Goldman DP, Philipson TJ. ‘Double Jeopardy’ in American Health Insurance. Forbes 2014.
- Langreth R. Secret Rebates: Why Patients Pay $600 for Drugs That Cost $300. Bloomberg News 2016.
- Palmer E. Pharma relying more on non-GAAP accounting and the SEC is noticing. FiercePharma. 2016. http://www.fiercepharma.com/pharma/pharma-relying-more-non-gaap-accountingand-sec-noticing-repor-says. Accessed March 19, 2017.
- Ramsey L. The world’s biggest drugmaker just pulled back the curtain on drug pricing. Business Insider. 2017. http://www. businessinsider.com/johnson-and-johnson-breakdown-on-drugpricing-2017-2. Accessed March 21, 2017.
- Bell J. Lilly offers up drug pricing details amid ongoing scrutiny of industry. BioPharma DIVE. 2017. http://www.biopharmadive. com/news/Eli-lilly-pricing-report/438474.
- Merck & Co Inc. Pricing Action Transparency Report 2016. http:// www.msdresponsibility.com/wp-content/uploads/2017/01/ Report-on-Pricing-Practices-in-the-US-2010-2016.pdf2017.
You must be logged in to post a comment.