Epidemiologists and public health professionals are aware of the seriousness of the COVID-19 pandemic, and the public is panicked. However, there has been remarkably little quantitative information on the path the epidemic might take, and the worst-case impact it could have on our medical system. This note uses a few statistics and educated guesses to estimate demand for hospital beds and deaths over the course of the epidemic if the virus remains as communicable and virulent as it currently appears, and efforts at containment and mitigation are ineffective. Table 1 gives the U.S. population in March 2020 by age, and estimates of the death rates at these ages for individuals who are infected by COVID-19. Population comes from Census projections, and death rates from the China-WHO COVID-19 tracking project. The number of deaths in each row is the product of population, the age-specific death rate, and an EU projection that 70 percent of the population will eventually be infected if containment measures are ineffective. The tabulation indicates that in the worst case where there is no effective containment, vaccination, or anti-viral mitigation before the end of this year, there would be a staggering 4.45 million deaths in the U.S. population.
Table 1: U.S. COVID-19 Infections, Hospitalizations and Deaths in 2020
| Age | 2020 US population (‘000) | Death rate if infected | Deaths (‘000) |
| 0-9 | 40,842 | 0.00% | 0 |
| 10-19 | 41,783 | 0.20% | 58.5 |
| 20-29 | 45,781 | 0.20% | 64.09 |
| 30-39 | 45,228 | 0.20% | 63.32 |
| 40-49 | 40,772 | 0.40% | 114.16 |
| 50-59 | 42,517 | 1.30% | 386.9 |
| 60-69 | 39,335 | 3.60% | 991.24 |
| 70-79 | 24,994 | 8.00% | 1,399.66 |
| 80+ | 13,253 | 14.80% | 1,373.01 |
| TOTAL | 334,505 | 1.90% | 4,450.89 |
Sources: Population; death rates
A standard epidemiological model gives a worst-case picture of how the epidemic will progress over time.[1] Let N denote the size of the age 60+ population, and nt denote the number of persons newly infected in week t. Assume that a newly infected person is contagious for one week following the week in which they become infected. Then nt = αnt-1 (N – Σj=1∞ nt-j), where α is the rate of transmission. Based on incomplete current data, assume that in the week of March 9 there are 667 newly infected and 1167 total infected cases, and 13 new deaths. Calibrate α so that the number of deaths in 2020 matches the total in Table 1. This model does not consider reinfections, which could prolong the epidemic. Based on the Chinese experience, the number of hospitalizations needed in a week is estimated to be 15 percent of the number of persons sick with the virus, and I assume the duration of sickness is two weeks. The number of deaths is estimated to be the number newly infected in the previous week, multiplied by the Table 1 population death rate of 1.9 percent among those infected.
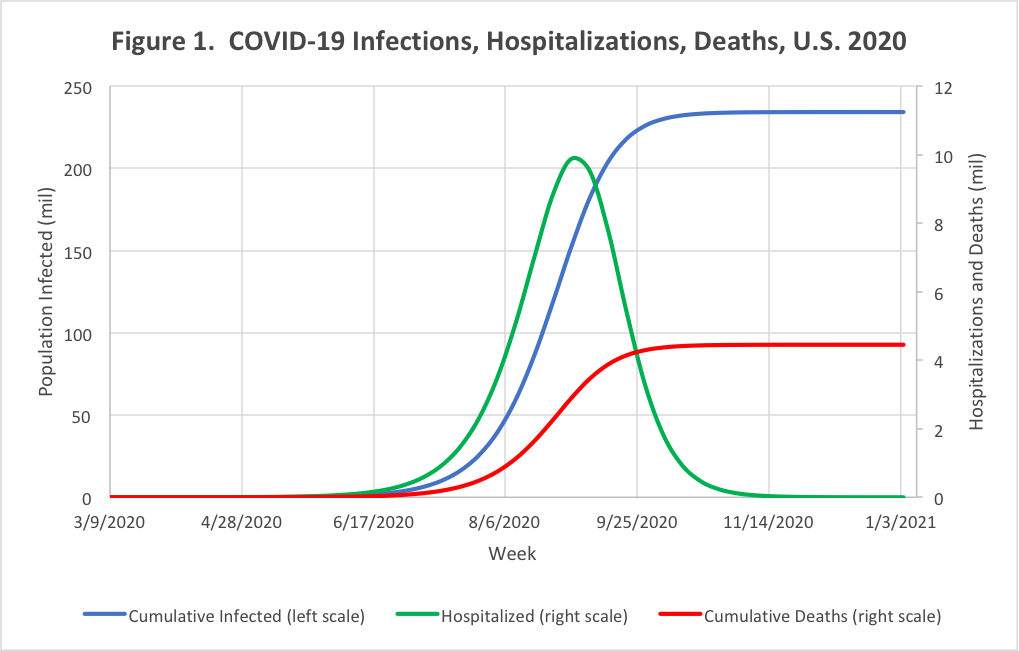
Figure 1 shows the model forecast of the development of the epidemic. The model places the peak of the epidemic in August, with an alarming weekly death rate over 600,000 and a need for almost 10 million hospital beds, at least a third of them in intensive care. Both the timing and height of the peak rate of hospitalizations and deaths are sensitive to assumptions, and even relatively modest containment and mitigation measures may bring the peaks and totals down substantially. However, these projected requirements are far in excess of America’s current hospital capacity. Protecting the American population against the COVID-19 epidemic if it turns out to be even close to this worst-case analysis calls for an immediate national mobilization to slow the rate of transmission to and among the elderly, prepare emergency hospital beds and respirators, and speed the development of tracking tools, anti-viral treatments, and vaccines.
[1] Kermack, W. O.; McKendrick, A. G. (1927). “A Contribution to the Mathematical Theory of Epidemics”. Proceedings of the Royal Society A: Mathematical, Physical and Engineering Sciences. 115 (772): 700.
You must be logged in to post a comment.