
Editor’s Note: This analysis is part of the USC-Brookings Schaeffer Initiative for Health Policy, which is a partnership between Economic Studies at Brookings and the University of Southern California Schaeffer Center for Health Policy & Economics. The Initiative aims to inform the national health care debate with rigorous, evidence-based analysis leading to practical recommendations using the collaborative strengths of USC and Brookings.
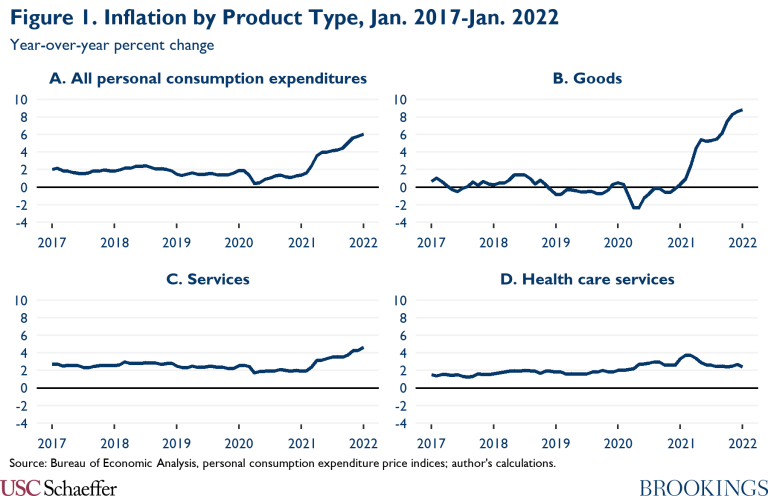
Consumer prices rose 6.1% over the twelve-month period ending in January 2022, driven by particularly rapid growth in goods prices. In parallel, wage growth has picked up too, with labor costs up 4.0% over the twelve months ending in December 2021. Higher prices for goods and labor translate into higher input costs in the service sector, so it is natural to expect the prices of services to rise in response. Indeed, service sector inflation rose meaningfully over the course of 2021 and is now well above pre-pandemic rates. Thus far, however, healthcare services are an exception; as shown in Figure 1, healthcare inflation is only modestly above its pre-pandemic rate and has been steady in recent months.[1]
This blog post examines why this has been the case. In brief, while healthcare providers’ input costs are indeed rising faster than in the past, peculiarities in how healthcare prices are set are limiting the degree to which those higher costs are translating into higher prices. One important factor is how Medicare updates its prices for changes in input costs. Annual updates for most services are based on projected growth in input costs, and the updates for 2021 and 2022 were finalized when expected inflation was still relatively low; furthermore, prices for physician services are not updated at all to reflect input cost changes. While Medicare directly accounts for only around one-quarter of total spending on healthcare services, there are a variety of linkages between Medicare’s prices and other payers’ prices, so slower growth in Medicare’s prices is likely restraining health care price growth outside of Medicare to some degree. Other factors, notably staggered contract renegotiation dates in private insurance and idiosyncratic features of states’ processes for updating Medicaid payment rates may also be playing a role.
Importantly, these dynamics will wane if inflation remains elevated in the years to come. Notably, faster growth in input prices would ultimately get incorporated into Medicare’s projections, causing Medicare’s nominal prices for most services to begin rising faster. However, Medicare’s rules generally do not allow for “catch-up” growth in subsequent years if its projections for a given year turn out to be too low, meaning that Medicare’s real prices for most services will remain on a persistently lower trajectory unless Congress intervenes. Some catch-up growth is possible outside of Medicare, at least to the extent that slow price growth in those sectors does not directly result from slow growth in Medicare’s prices. Regardless, for as long as growth in the prices of healthcare services remains subdued, this slow growth will have a modest moderating effect on overall inflation since health care services account for 16% of all personal consumption spending.
How will economy-wide increases in prices and wages affect Medicare prices?
Medicare sets the prices it pays for healthcare services using formulas established by law and regulation. Those formulas specify methods for determining the relative prices of different services (e.g., conducting an office visit or performing a surgery) as well as how those prices are updated over time.[2]
For physician services, the Medicare statute specifies annual percentage payment increases that do not depend on input costs. For example, for calendar year 2022, the annual update is 0%. Thus, absent action by Congress, broader price and wage trends have no effect on what Medicare pays for physician services. Physician services (and other professional services also paid for under Medicare’s physician fee schedule) accounted for 18% of traditional Medicare’s spending on health care services in 2019.[3]
For most other services, including hospital and post-acute services, Medicare’s rules specify annual payment updates that are based in part on changes in input costs, as measured by a “market basket index” specific to each type of provider.[4] Importantly, however, each year’s update is determined using the projected change in the market basket index for that year,[5] and that projection is typically finalized in the second quarter of the prior calendar year.[6] Furthermore, with a few relatively minor exceptions, projection errors are not accounted for when determining the next year’s payment update.[7] Thus, if the projected market basket update for a particular year turns out to be too low, then prices will be lower than intended in that year, and prices will be lower in all future years.
This process is greatly limiting how much the current burst of inflation is increasing Medicare’s prices. To take the leading example, consider inpatient services. The fiscal year 2021 payment update was based on projections finalized in the second quarter of calendar year 2020, when inflation fears were not even a glimmer on the horizon; correspondingly, the projected market basket increase for fiscal year 2021 was just 2.4%, below the actual increase of 3.1%. Similarly, the fiscal year 2022 payment update was based on projections finalized in the second quarter of calendar year 2021, when inflation forecasts were generally still relatively low; correspondingly, the projected market basket increase for fiscal year 2022 was a relatively subdued 2.7%. Yet in light of the data already in hand through the fourth quarter of calendar year 2021, the actual increase in the market basket for fiscal year 2022 will be much higher; it will be 4.1% even if growth in the market basket index reverts to its pre-COVID pace for the remaining three quarters of the fiscal year, and it will be 5.3% if growth matches the trend over the four quarters of calendar year 2021. For other services, the particulars may differ, but the overall picture is likely similar.
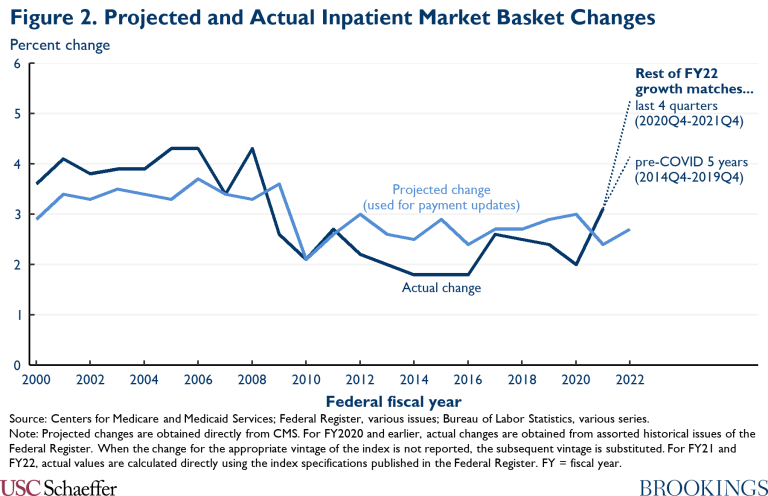
Notably, as depicted in Figure 2, the recent historical pattern had been for Medicare’s projections to overestimate the actual increase in the market basket; for fiscal years 2009-2019, the projected change in the market basket index was 0.4 percentage points above the actual increase, on average. Viewed relative to this history, the underestimates for fiscal years 2021 and 2022 are even more remarkable.
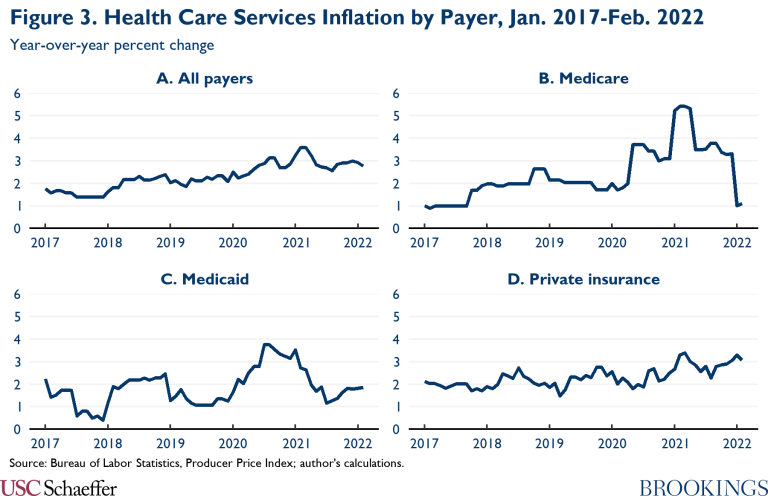
Consistent with these modest annual updates, the overall prices Medicare pays for health care services are up only 1.1% over the twelve months ending in February 2022, as depicted in Panel B of Figure 3. Other policy factors may soon temporarily push the rate of growth of Medicare prices even lower. The faster price growth observed in 2020 and 2021 largely reflected a set of temporary payment changes, including: a 20% price increase for inpatient stays including a COVID-19 diagnosis; the May 2020 suspension of the 2% reduction caused by the Budget Control Act sequestration; and a temporary increase in Medicare physician payment rates for calendar years 2021 and 2022. The increase for COVID-19 inpatient stays will cease whenever the federally declared public health emergency ends, which may happen in the coming months, and the latter two changes are scheduled to expire on a similar timeline.
Importantly, the fact that growth in Medicare’s prices remains low—and appears poised to remain low through 2022—does not mean that this will continue in the years to come. Sustained higher inflation would ultimately increase Medicare’s projections of growth in the relevant market basket indices, which (except for physician services) would then translate into faster growth in Medicare’s nominal prices. On the other hand, if growth in input costs does soon return to normal, then growth in Medicare’s prices is likely to remain subdued; as noted above, Medicare’s systems for determining annual payment updates generally do not account for prior forecast errors, so Medicare’s prices will not experience significant “catch-up” growth. A corollary is that the real prices Medicare pays for most health care services will remain on a permanently lower trajectory than they would have been if the current period of elevated inflation had not occurred (unless Congress intervenes to make offsetting changes).
How Will Economy-Wide Increases in Prices and Wages Affect Other Payers?
Medicare is the single largest health care purchaser in the United States, but only accounts for around one-quarter of total spending on health care services.[8] However, as depicted in Panels C and D of Figure 3, the prices paid by state Medicaid programs and private insurers also continue to grow relatively slowly, although growth in private insurers’ prices picked up modestly over the course of 2021. This raises the question of why increases in input costs are not driving these payers’ prices higher.
In Medicaid, this may partially reflect linkages with Medicare’s prices. In some instances, states specify payment rates as a percentage of Medicare’s prices.[9] Moreover, for all states, aggregate Medicaid payments to institutional providers (e.g., hospitals) cannot exceed what Medicare would have paid, and these limits appear to sometimes bind. Even where states set prices independently of Medicare, the administrative or legislative processes that they use may still have features that cause prices to respond incompletely to changes in input costs (e.g., inattention to input costs or reliance on projections).[10]
The continued moderate growth of prices paid by private insurers is perhaps more surprising. Those prices are typically determined through decentralized negotiations between insurers and health care providers, and an increase in the overall price level should, in theory, allow providers to negotiate commensurately higher prices. One potential explanation for why this has not happened is that provider-insurer contracts are only periodically renegotiated and most of those renegotiations have not yet occurred. Another potential explanation is that sluggish growth in Medicare’s prices is having direct effect on private prices, as there is empirical evidence that changes in Medicare rates often cause private rates to move in the same direction. Most strikingly, research by Jeffrey Clemens and Joshua Gottlieb examined an episode where Medicare increased its physician payment rates in some geographic areas and reduced them in others; they found that when Medicare’s prices rose, private insurers’ prices rose roughly dollar-for-dollar. Other work has found directionally similar, albeit quantitatively smaller, effects for hospital prices.[11]
Under most of the potential explanations reviewed above, sustained higher inflation would ultimately result in faster growth in Medicaid and private insurance prices, paralleling the outlook for Medicare’s prices. However, unlike in Medicare, there may be some scope for “catch-up” growth in these payers’ prices in the coming years. Catch-up growth would be likely if the slow growth to date partly reflects lags in renegotiating provider-insurer contracts. On the other hand, to the extent that the current slow growth in Medicaid and private prices is caused by slow growth in Medicare prices, then the lack of catch-up growth in Medicare might translate into a lack of catch-up growth for these payers as well.
What Will These Price Trends Mean for the Healthcare System?
The analysis above indicates that the prices received by health care providers are rising more slowly than providers’ input costs and that those prices may not fully “catch up” with input costs in the years to come, particularly in Medicare. While this will reduce burdens on those who pay for health care (some combination of governments, employers, and consumers), it will force providers to either accept lower margins or reduce their costs. These responses could have implications for quality or access.
Assessing whether this reduction in the real prices of health care services is a good thing or a bad thing is beyond the scope of this piece, but it will fundamentally depend on whether prices were too high or too low to start with, a topic of vehement debate. The answer to this question is also likely to differ by payer and service line. For example, reductions in the real prices Medicaid pays for physician services might be of particular concern given the longstanding challenges that Medicaid enrollees face in accessing physician services. By contrast, reductions in the prices that private insurers pay for hospital services might elicit less concern since those prices are far above hospitals’ marginal cost of delivering services.
What Does This Mean for Aggregate Inflation?
Because health care services account for 16% of all personal consumption expenditures (PCE), trends in health care prices have modest implications for overall inflation, at least as measured by the PCE price index. The analysis presented above implies that, if the actual increase in input cost growth had been fully reflected in Medicare’s payment updates, then payment updates for fiscal year 2022 would have been around 2.5 percentage points larger.[12] This increase in Medicare’s payments would mechanically increase the overall PCE price index by about 0.1 percentage points. If prices of all health care services were 2.5 percentage points higher, that would increase the PCE price index by 0.4 percentage points.
Higher health care prices would have a smaller effect on the Consumer Price Index (CPI) than on the PCE price index. The CPI encompasses only health care directly paid for by consumers via premiums and cost-sharing and, thus, excludes amounts paid for by governments through Medicare or Medicaid, as well as amounts paid for by employers under employer-sponsored plans. As a result, health care services account for just 6% of the CPI-U basket, far below the 16% weight they hold in the PCE price index.[13]
Importantly, the calculations above capture only the mechanical effects of changes in the prices of health care services. In a counterfactual world in which health care prices were higher, economic actors might change their behavior in ways that would change the overall price level. First, health care providers (or their owners) would receive higher revenue, while those who pay for health care would incur higher costs; to the extent that providers have a different propensity to consume than payers, this could affect aggregate demand and, in turn, the overall price level. Second, higher health care prices might cause consumers to substitute away from health care toward other goods and services, which would put upward pressure on the prices of those other products. Third, higher health care prices would raise employers’ cost of providing health insurance; to the extent that wages, premiums, and plan designs are fixed in the short run, this would tend to increase compensation costs and put upward pressure on prices.
Estimating the size of these general equilibrium effects is behind the scope of this piece. However, the effect of the first channel enumerated above seems likely to be relatively small in this instance; in the short run, wages, premiums, and plan designs are largely fixed, so the burden of higher health care prices would fall primarily on governments and employers rather than consumers. (Even in the long run, a substantial fraction would fall on governments since essentially all health insurance is either provided by public programs or subsidized through the tax system.) This fact likely mutes the aggregate demand consequences of the shift in purchasing power from payers to providers caused by higher prices. Since the other two channels enumerated above seem likely to reinforce the upward pressure on the price level from higher health care prices, this suggests that the effect on the equilibrium price level is unlikely to be substantially smaller (and could be larger) than the mechanical effect.
Footnotes:
[1] The Bureau of Economic Analysis health care services category does not encompass all types of health care. Notably, it excludes retail prescription drugs and durable medical equipment.
[2] Nearly half of Medicare enrollees now receive coverage through private Medicare Advantage plans rather than traditional Medicare. Medicare Advantage plans determine the prices they pay for health care services via negotiations with providers, so these prices could deviate from traditional Medicare’s prices in principle. However, because of features of the institutional environment, the prices Medicare Advantage plans pay for most services closely track traditional Medicare’s, so I focus exclusively on traditional Medicare’s prices here.
[3] This estimate was derived from the 2020 Medicare Trustees Report. This estimate reflects only the Medicare program’s payments for these services and excludes patient cost-sharing payments. Including cost-sharing payment might increase this share slightly.
[4] For most services, the update is the projected percentage change in the market basket index, minus a “productivity adjustment” that equals the average percentage point change in economy-wide multifactor productivity over the preceding ten years. Some types of care that are typically included in the “health care services” category, including laboratory tests and physician-administered drugs, use different update methods.
[5] Depending on the payment system, a “year” is sometimes a federal fiscal year and sometimes a calendar year. Additionally, the time period for which Medicare establishes payment rates does not always align with the time period for which it calculates the change in the market basket. For example, Medicare’s outpatient prospective payment system establishes payments on a calendar year basis, but annual updates are based on the increase in the inpatient prospective payment system market basket, which is calculated on a fiscal year basis.
[6] For home health services, projections are finalized in the third quarter rather than the second quarter.
[7] Some payment systems do allow for a forecast error correction. These include the skilled nursing facility prospective payment system as well as the small capital portion of the inpatient prospective payment system.
[8] According to the National Health Expenditure Accounts, Medicare directly paid for 24% of health care services (defined here as personal health care less retail outlet sales of medical products) in 2019. Accounting for associated cost-sharing payments would push Medicare’s share of total spending modestly above one-quarter.
[9] These types of explicit linkages with Medicare rates also exist in some federal programs. The Department of Defense’s TRICARE program generally pays Medicare prices for health care services, and the Department of Veterans Affairs does the same for care delivered outside its facilities.
[10] Around half of Medicaid spending now occurs through managed care plans, rather than states’ traditional fee-for-service programs. In principle, one might expect the prices paid by managed care plans to evolve independently of states’ fee-for-service prices and, perhaps, to take greater account of changes in input costs. However, plan capitation rates are often set at least in part based on fee-for-service costs, and states sometimes require managed care plans to pay no less than fee-for service prices. One study of five state programs focused on hospital care found that this often results in managed care prices being very close to fee-for-service prices, echoing the close concordance observed between the prices paid by Medicare Advantage plans and traditional Medicare.
[11] It is not completely clear why private prices sometimes move in tandem with Medicare’s prices. In the short run, this may be because some contracts directly specify prices as a percentage of Medicare prices. Over the long run, it could be because treating Medicare patients is many providers’ “outside option,” so lower Medicare rates reduce providers’ leverage in negotiations with private insurers. Alternatively, the financial pressure created by lower Medicare rates could lead providers to reduce their (marginal) costs, which in turn lowers private prices.
[12] Specifically, averaging the two scenarios depicted in Figure 2 implies that the inpatient market basket index will grow by 4.7% in fiscal year 2022, which is 2.5 percentage points higher than the 2.2% average growth observed in fiscal years 2015 through 2019. But projected growth for fiscal year 2022 was almost exactly equal to average projected growth for fiscal year 2015 through 2019, so none of the actual uptick in input cost growth was reflected in Medicare’s projection. Calculations for Medicare’s other payment systems would likely be similar.
[13] The CPI “medical care services” category includes health insurance services, while the PCE “health care services” category does not. For comparability, this 6% figure excludes the weight the CPI assigns to health insurance.
You must be logged in to post a comment.