In late March the Coronavirus Aid, Relief, and Economic Security (CARES) Act was signed into law, which provided $2 trillion in relief for those affected by the coronavirus pandemic, including $100 billion to allocated to hospitals and other healthcare entities. The latest relief package passed signed by President Trump provides an additional $75 billion in emergency funding for hospitals. These funds are intended to help hospitals stabilize their finances as they face short term challenges of managing COVID-19. While debate about the appropriate level of financial support that hospitals should receive is ongoing, it is worth taking a look at the financial outlook and viability of hospitals going into the crisis.
In recent years, the hospital sector on the whole has been financially sound. In general, hospitals have improved patient outcomes and their productivity in delivering care. Hospitals have developed new systems and partnerships as payers have trended toward value-based payments and other new payment models. But it is important to note this masks uneven performance across the sector.
The coronavirus pandemic is a major shock to hospital finances, putting pressure on budgets from two sides. Most significantly, the vast majority of elective surgeries and preventative procedures have been postponed, which has led to decreased revenue. Surprisingly, while headlines have featured emergency rooms at capacity and calls for more ER and intensive care providers, many hospital workers have been furloughed. At the same time, hospitals are facing spending pressures to acquire equipment and supplies to meet the projected surge of COVID-19 patients.
Given this dynamic and challenging situation, the financial sustainability of hospitals is critically important, if for no other reason than the threat of a second wave of COVID-19 infections some months from now. As policymakers consider how to proceed in allocating resources, good information on the financial situation of hospitals is critically important.
Below is a map-based database on the baseline position of hospitals, before COVID-19, using the most recent reporting by hospitals to the federal government (with reporting periods ending mostly commonly in the fourth quarter of 2018). The database can be searched by geography.
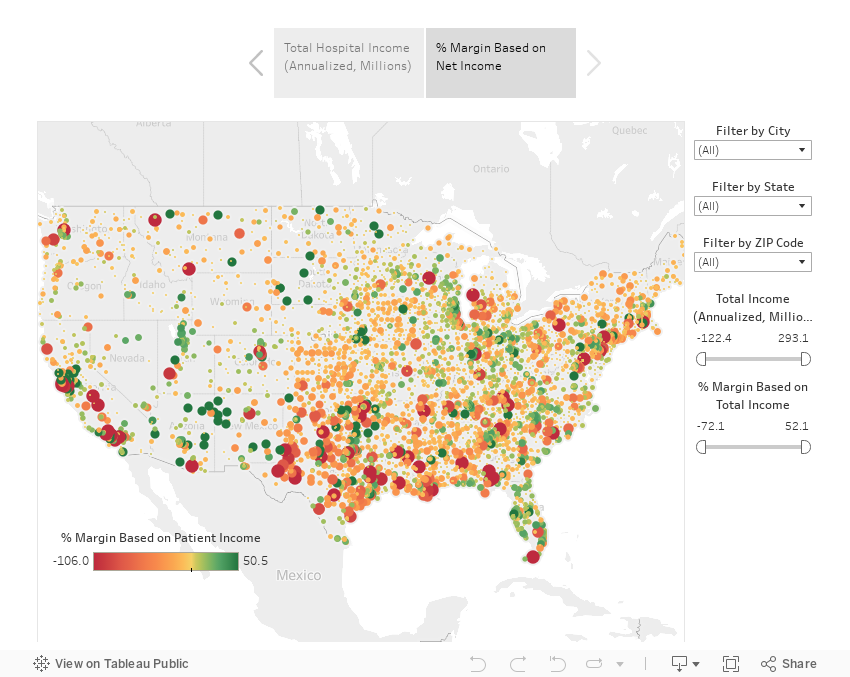
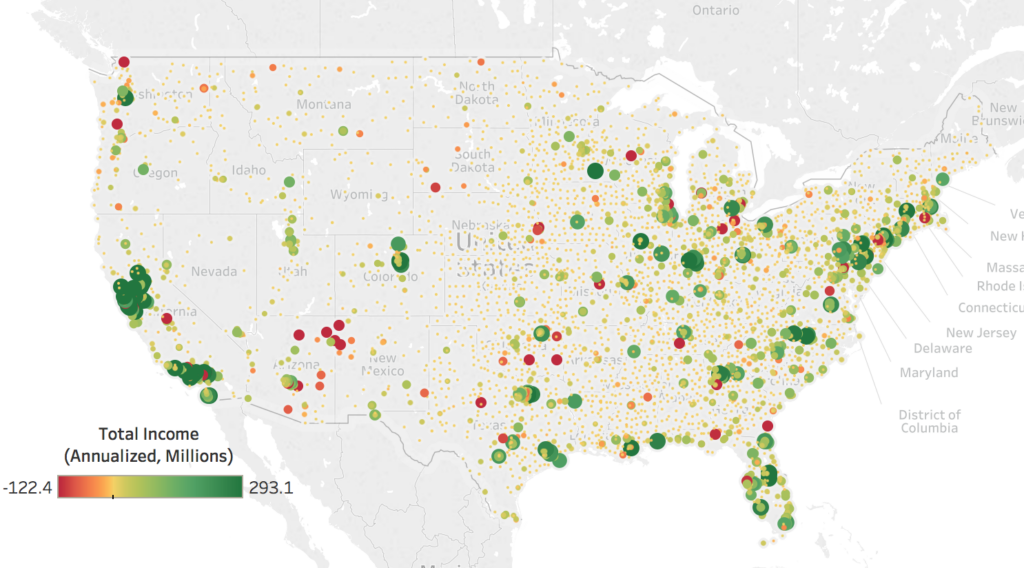
Above, the map above shows total hospital income, annualized in millions. Negative income is represented by red dots and positive income by green dots. The larger the dot, the greater the absolute value of the datapoint. When hovering over a datapoint, the user can view the reporting period, as well as the margin based on income (%) and whether or not the data is winsorized. To search by state, city or ZIP code, or by data values, use the table filters on the right. Using the tabs at the top, users can navigate to a second map developed from margin based on income (%) data.
Key Findings:
- 64 percent of hospitals reported positive financial gains, defined by revenues reported exceeding costs. The average hospital reported a $13.5 million surplus. The average margin (income divided by revenues) was 2.9 percent.
- Beyond these averages, there are significant differences in performance. The top quarter of hospitals had positive and sizable margins (19.4% on average), while the bottom quarter had large negative margins (-14.5% on average).
- Publicly-owned hospitals, which account for 8 percent of all hospitals and are ineligible for CARES Act funding, have margins that averaged +3.0 percent in their most recent reporting (most commonly ending in the fourth quarter of 2018).
- Margins at Critical Access Hospitals, typically high need hospitals in rural areas, have been lower than those at other hospitals (1.2% on average, versus 3.6%)
These differences are policy-relevant and show that a one-size-fits-all solution is probably not the best one. Hospitals are in very different circumstances and are being impacted in different ways by the coronavirus. Understanding these differences and their implications is critical. Policymakers should be well aware of the long-term fiscal health of these hospitals as they consider allocation of resources and other measures that might be taken.
Methodology
The primary data source is the Healthcare Cost Report Information System (HCRIS). In particular, I use the “cost report” filed most recently by each hospital. HCRIS reports total (net) income, revenues, provider type, provider location, provider status (value of 3 for termination excluded), critical access status, public ownership, reporting period(s), and Medicare provider number. I identified hospitals using the provider category code (values of 1 or 11, the latter for critical access). Income was annualized based on total days included in reporting period(s). Margins were calculated as (un-annualized) income divided by revenues. Specifically, in worksheet G3, line 29 was divided by the sum of lines 3 and 25; where line 25 was not reported, the value was treated as a zero. Financial outcomes were winsorized at the 1st and 99th percentiles of their distributions. Geocoordinates were obtained from the American Hospital Association Annual Survey (2015); where unavailable, hospital locations were geocoded.